Omada SDN Controller User Guide
- About this Guide
- Chapter 1 Omada SDN Controller Solution Overview
- Chapter 2 Get Started with Omada SDN Controller
- Chapter 3 Manage Omada Managed Devices and Sites
- Chapter 4 Configure the Network with Omada SDN Controller
- Chapter 5 Configure the Omada SDN Controller
- Chapter 6 Configure and Monitor Omada Managed Devices
- Chapter 7 Monitor and Manage the Clients
- Chapter 8 Monitor the network
- Chapter 9 Manage Administrator Accounts of Omada SDN Controller
- Chapter 10 Omada APP
This chapter guides you on how to monitor the network devices, clients, and their statistics. Through visual and real-time presentations, Omada SDN Controller keeps you informed about the accurate status of the managed network. This chapter includes the following sections:
�? 8. 1 View the Status of Network with Dashboard
�? 8. 2 View the Statistics of the Network
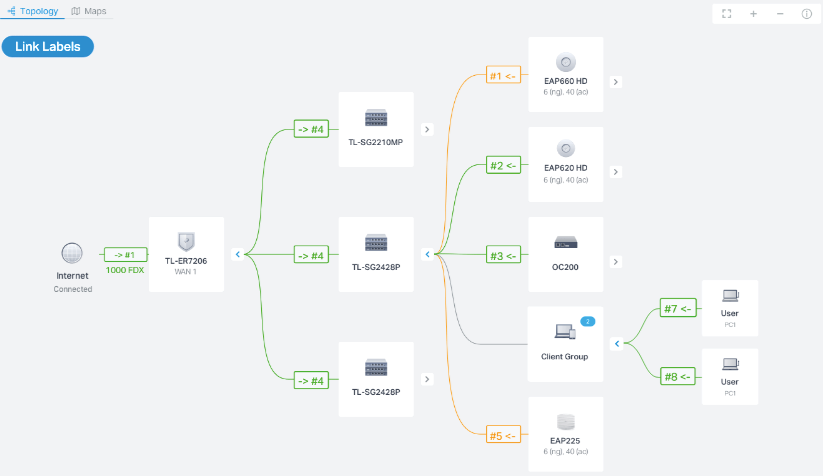
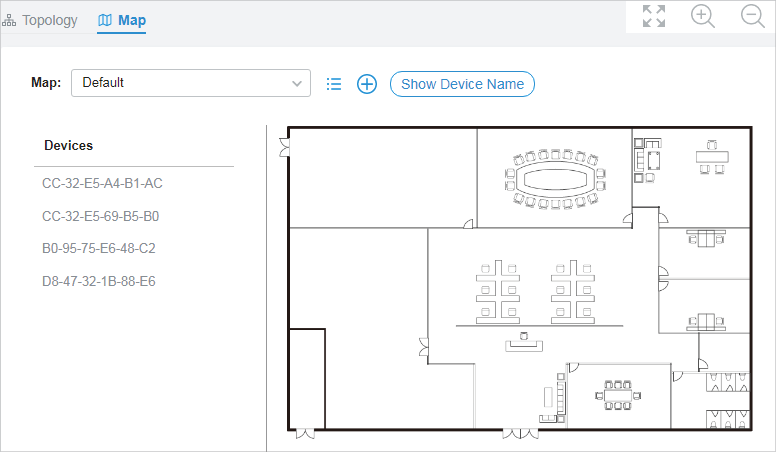
�? 8. 3 Monitor the Network with Map
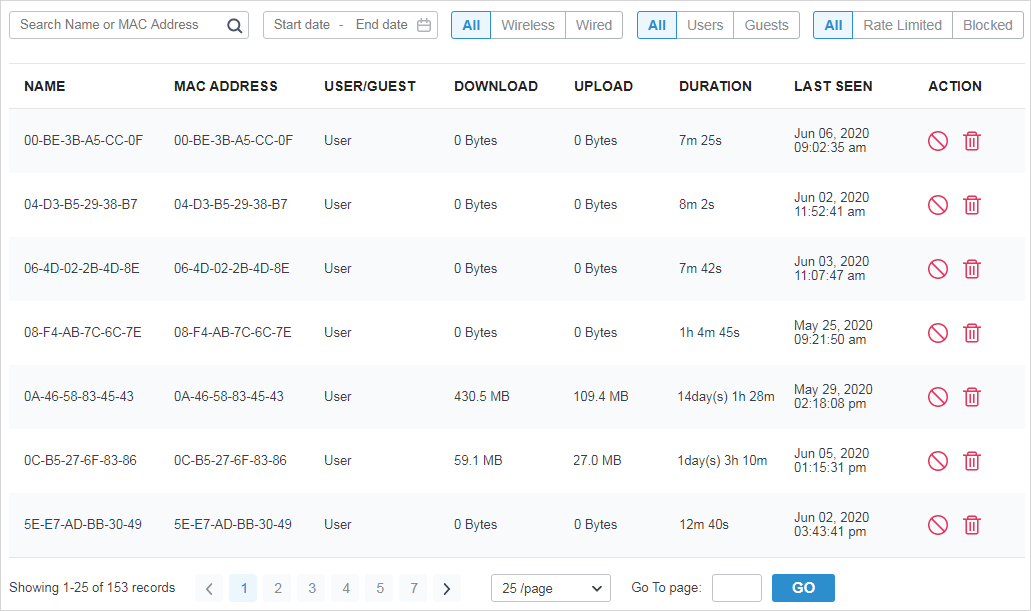
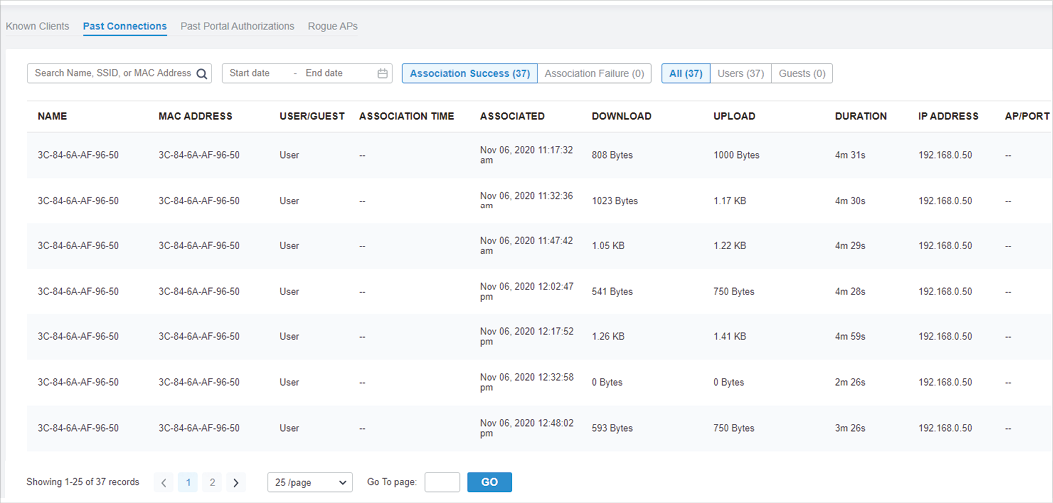
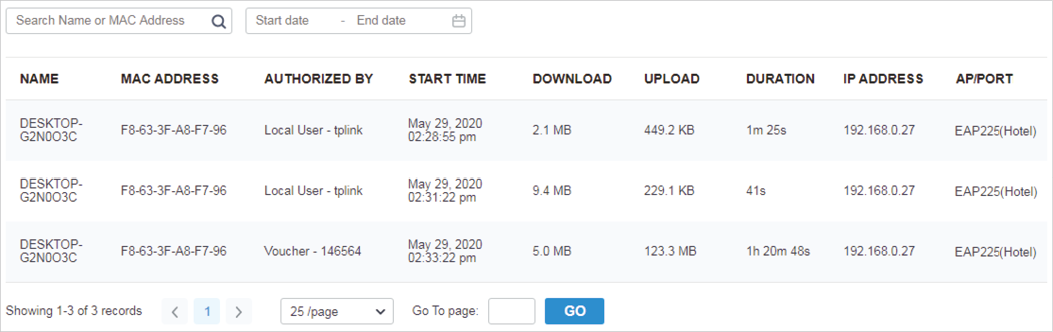
�? 8. 4 View the Statistics During Specified Period with Insight
8. 1 View the Status of Network with Dashboard
8. 1. 1 Page Layout of Dashboard
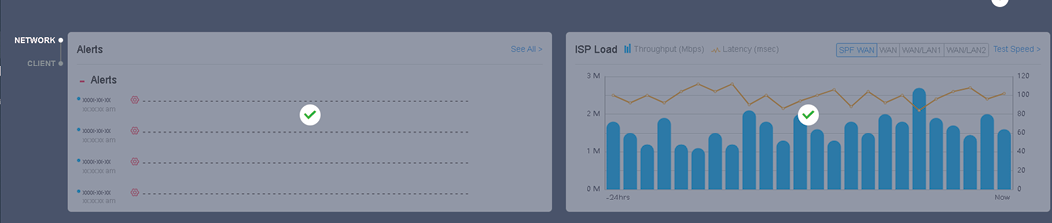
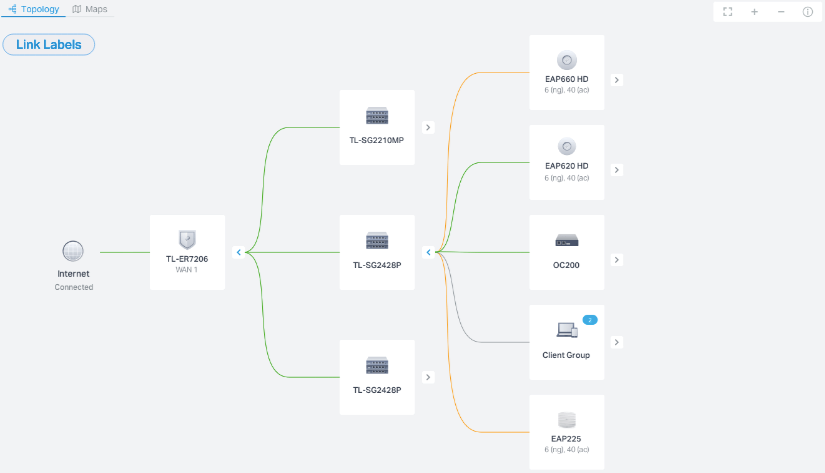
Dashboard is designed for a quick real-time monitor of the site network. An overview of network topology is at the top of Dashboard, and the below is a tab bar followed with customized widgets.
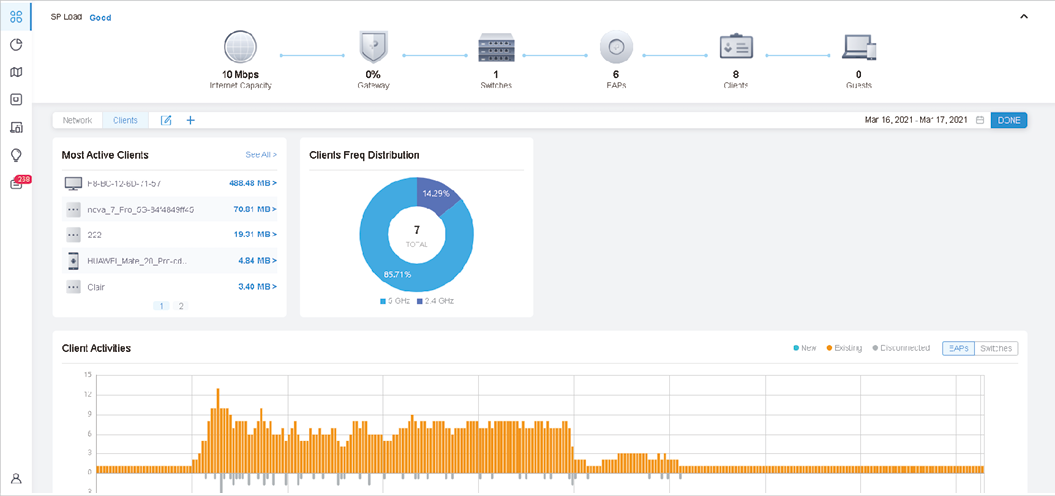
Topology Overview on the top shows the status of ISP Load and numbers of devices, clients and guests. ISP Load has four statuses: Unknown, Good, Medium, Poor.
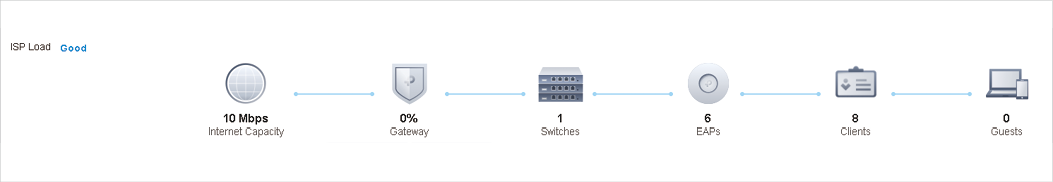
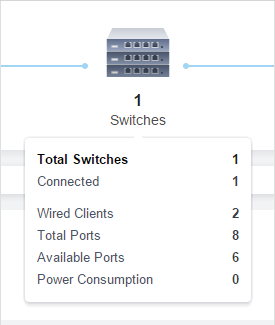
You can hover the cursor over the gateway, switch, AP, client or guest icons to check their status. For detailed information, click the icon here to jump to the Devices or Clients section.
You can customize the widgets displayed on the tab for Dashboard page. Three tabs are created by default and cannot be deleted.

|
Network |
|
Clients |
In the tab bar, you can take the following action to edit the tabs and customize the widget to be displayed.
|