Tapo Smart Plug Energy Monitoring: How to Use Every Feature
This guide covers the upgraded Tapo plug's energy-monitoring features, designed to help you better understand your power consumption and reduce electricity costs. Tapo smart plugs with energy monitoring, such as the Tapo P110 and P115, let you track real-time power draw, view usage history, calculate estimated electricity costs, and protect connected devices from power overloads. To use these features, the Tapo P110 or P115 must be on firmware version 1.1.2 or newer, and the Tapo app must be updated to version 2.10.x or newer. The sections below cover all eight features in detail.
Key Takeaways
- The energy monitoring dashboard displays today's power consumption, the past 30 days' consumption, and the current real-time power draw, refreshed every five seconds.
- Energy usage can be viewed by day, month, or year through the Energy Usage Graph, and power data can be reviewed by day or week in the Power Graph.
- The Energy Calendar displays daily power consumption for the past three months and uses color coding — blue, orange, and red — to indicate lower, average, and higher consumption levels.
- The Electric Bill Calculator supports both Singular billing (fixed rate) and Periodic billing (variable rate), allowing you to enter your electricity rate to estimate the cost per device.
- The Power Protection feature automatically turns off the plug if power consumption exceeds a custom threshold for 10 consecutive readings, and sends a push notification to your phone.
- Energy usage data can be reset to zero or exported locally from the app without needing to perform a factory reset.
Tapo Energy Monitoring Features
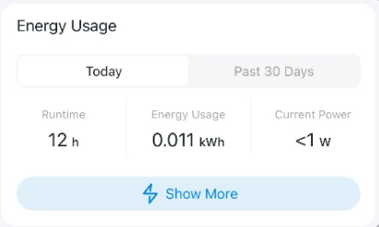
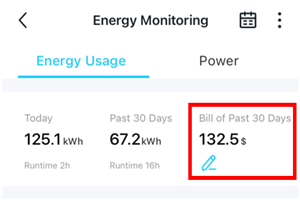
Feature 1. Tapo Energy Monitoring Dashboard: Real-Time Power Tracking
- Power consumption of Today: Display the energy consumption of “today” between 0:00 and the current time.
- Power consumption of Past 30 Days: Display energy consumption in the past 30 days.
- Current power: Refresh real-time power value every 5 seconds.
- Energy Measurement to 0.001 kWh: More decimal places in the energy consumption metric to 0.001Kwh (1W) help you see more accurate energy data.
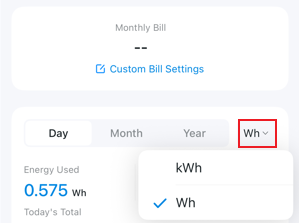
- Energy unit switching: Choose the display unit for energy usage (kWh or Wh). Unit availability may differ by device model.
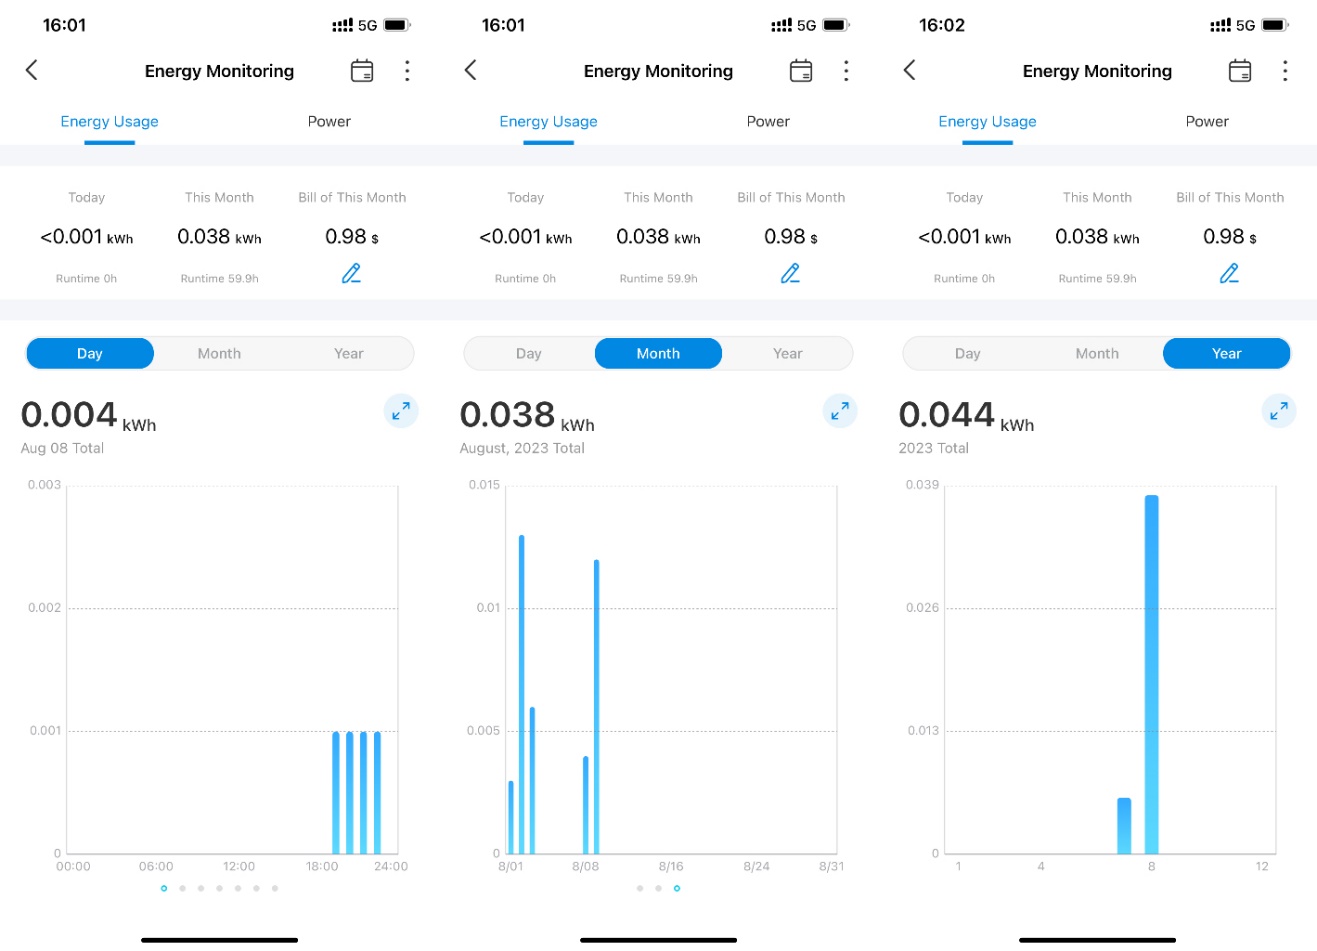
Feature 2. Energy Usage and Power Graphs: Track Consumption Over Time
With straightforward graphs, you can easily know when your appliances are consuming the most power, and how much power they consume at different times. It can also display your power consumption in the calendar view.
Energy Usage Graph: You can now check your total power consumption by day, month, or year.
- Day: Display the energy usage in the past 7 days, with a minimum time interval of an hour.
- Month: Displays energy usage for the past 3 months, with a minimum time interval of one day.
- Year: Display the energy usage in the past 12 months; the minimum time interval is a month.
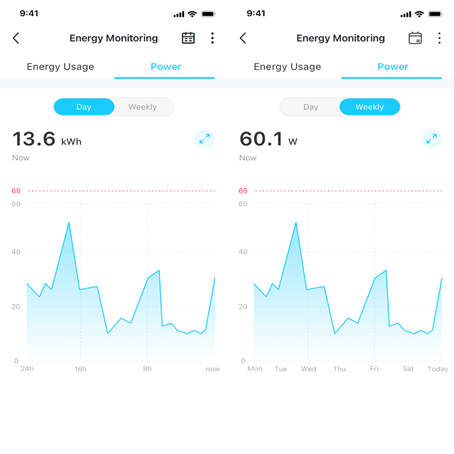
Power Graph: You can review the power data at a different time during the past day or week.
- Day: Display the power value in the past 24 hours, the minimum time interval is 5 minutes.
- Week: Display the power value of the past 7 days, the minimum time interval is 1 hour.
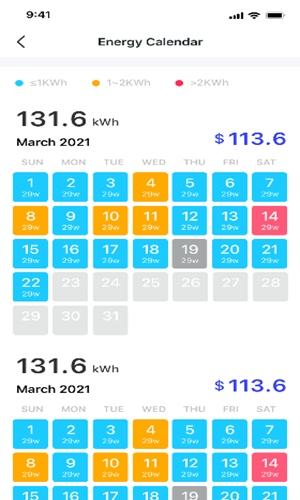
Feature 3. Energy Calendar: View Daily Consumption at a Glance
- Daily Energy usage in a Calendar: Display daily power consumption in the past 3 months and the Monthly electric bill.
- Visualizing electricity consumption with colors: Use blue, orange, and red to represent lower, average, and higher electricity consumption levels.
Feature 4. Electric Bill Calculator: Estimate Your Energy Costs
Bill of the past 30 days: Display the accumulated electric bill for the past 30 days.
Input your electricity rate to get an estimated cost of the power consumed by each connected device.
The Tapo app has Singular Billing and Periodic Billing types.
Notes:
1. The price unit by default is consistent with the unit of the Tapo Care subscription.
2. Electric Bill in the app provides an estimated cost for reference only, the real electricity costs will depend on the electric company.
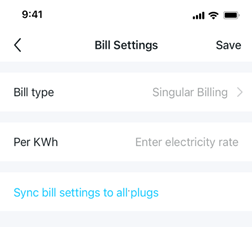
Feature 5. Singular Billing: For Fixed-Rate Energy Plans
Select Singular billing if you have a fixed-rate energy plan. Fixed-rate means that the price you pay per kilowatt-hour (kWh) stays the same throughout your usage.
Calculation formula: bill of this month = (electricity rate per kWh) x (total energy consumption of this month).
Feature 6. Periodic Billing: For Variable-Rate Energy Plans
Select Periodic billing if you have a variable-rate energy plan. Variable-rate means that the price you pay per kilowatt-hour (kWh) could go up or down in a day or in different seasons of the year.
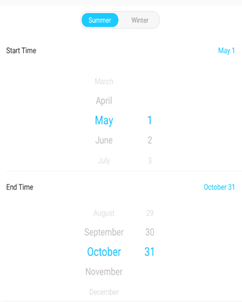
You can set variable electricity rates by season (Winter and Summer), Workday and weekend, or by Peak/Mid and Peak/Off-peak hours.
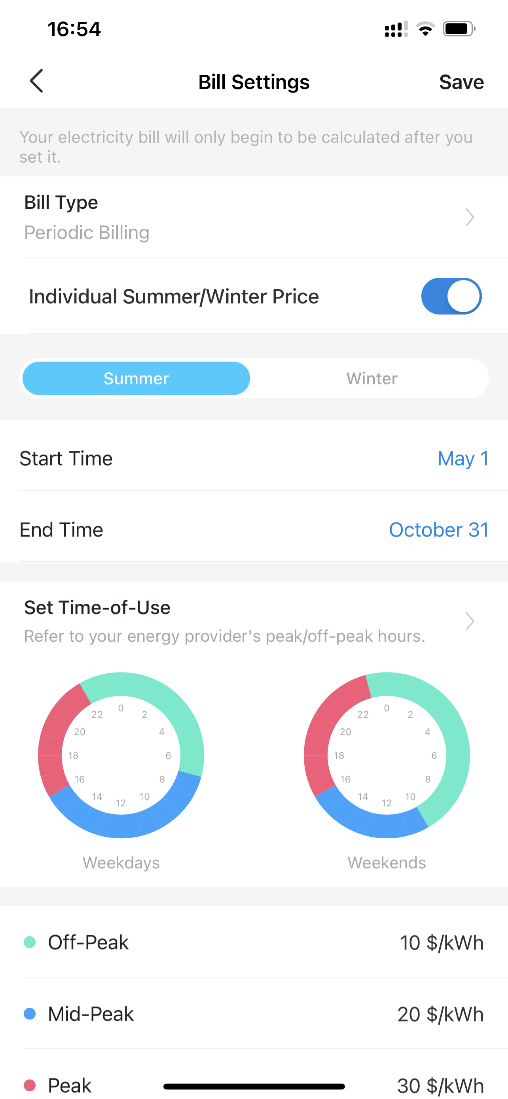
Winter and summer
- Summer (customizable): May 1st – Oct. 31st
- Winter (customizable): Nov. 1st – April 30th
Workdays and weekends
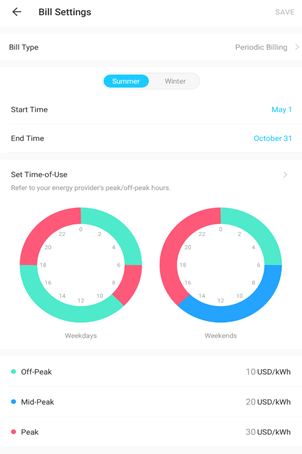
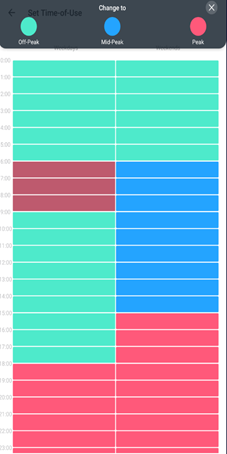
A day is divided into 3 periods: off-peak, mid-peak, and peak.
Calculation formula: bill of this month = (peak hours x peak hour price) + (mid-peak hour x mid-peak hour price) + (off-peak hours x off-peak price)
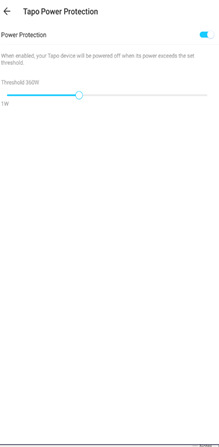
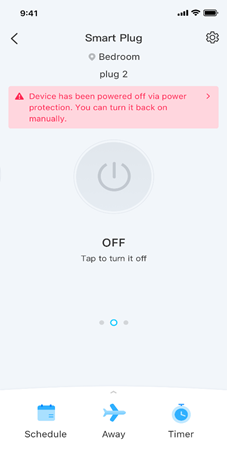
Feature 7. Tapo Power Protection: Auto Shut-Off for Overload Prevention
- Power Sensing as Trigger: You can set Auto Power Off for the connected device when its power exceeds your customized threshold. The plug monitors power every 5 seconds. If consumption exceeds the set threshold for 10 consecutive readings, auto-shutdown activates. This feature protects your electronics and prevents fire hazards caused by overloads.
- Customized threshold: You can manually set the threshold by dragging the scroll bar left and right.
Adjustable range:1W-3670W
Minimum adjustment unit:10W
- Notification reminder: When the Tapo plug detects an overload, it will automatically shut off and send a push notification to your mobile device.
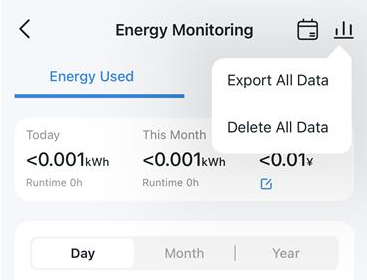
Feature 8. Reset and Export Energy Usage Data
- Delete Energy Usage Data: You can reset energy data to zero directly in the app — no factory reset required.
- Export All Energy Usage Data: Export and save your power data locally for record-keeping or further analysis.
You can also check the article on the forum: Tapo Plug Energy Monitoring 2.0 Update.
Looking For More
¿Es útil esta pregunta frecuente?
Sus comentarios nos ayudan a mejorar este sitio.


TP-Link Community
Still need help? Search for answers, ask questions, and get help from TP-Link experts and other users around the world.