


如何在 Omada Central 控制器上設定人數統計功能
內容
目的
本文介紹如何在 Omada Central 上設定「人數統計」功能,內容包含應用情境、設定說明、使用技巧,以及支援該功能的設備清單(NVR 與 IPC)。
需求
- VIGI 攝影機
- VIGI 監控主機
- Omada 雲端系統 > Omada 安防系統
介紹
人數統計功能主要應用於商業零售店與超市。透過分析路過、進入與離開的人流數據,可產生詳細的人數統計報告。這些報告能協助企業:
- 透過辨識高人流區域,優化店面佈局並提升轉換率。
- 據尖峰時段趨勢調整資源分配,優化營運策略,包括人力排班與庫存管理。
- 根據人數統計數據進行銷售預測與行銷策略調整,實現以數據為導向的決策,優化市場策略。
應用情境多樣且複雜。為提升人數統計的準確性,該功能透過偵測人物的頭部特徵來辨識人員。
設定
人數統計功能需同時支援 VIGI 網路攝影機(IPC)與 VIGI 監控主機(NVR)。支援人數統計的設備可參考以下連結:
https://www.vigi.com/tw/vigi-people-counting/product-list/
IPC 負責擷取影像數據,NVR 則將數據傳送至 Omada Central 進行集中式分析與報表產出。本文將提供人數統計功能的詳細設定說明,並提供人數報表與使用建議。
由 Omada Central Standard 管理的 VIGI IPC 需要授權 (License) 才能啟用該設備,而 VIGI NVR 則不需要授權。
關於 Omada 授權的購買與設定指南,請參考以下常見問題: Omada License Configuration Guide | TP-Link
設定說明
在開始使用人數統計功能之前,請先確認您的設備是否支援此功能。
步驟 1. 點選 設備 > 事件 > VCA > 智慧分析設定,並選擇人數統計模式。

點擊套用,設備將會重啟。5分鐘後請重新整理此頁面並確認設定內容。

備註:
- NVR 和攝影機皆必須設定為人數統計模式。
- 在智慧分析設定頁面中,四種模式一次只能啟用一種。
步驟 2. 點選 VCA > 人物計數,並啟用人物計數。

步驟 3. 點擊 ‘+’ 建立人數統計區域並設定進入及離開的規則。
- 最大可在畫面中建立 3 個人數統計區塊。
- 人數統計區塊不可重疊。
- 在人數統計區域邊緣與攝影機畫面邊緣之間保留足夠的空間。
- 偵測區域和規則應根據實際情況調整。

規則說明
藍色區塊內為攝影機的監控範圍,黃色區塊為人數統計區域,紅色線將黃色區塊劃分為 "Inside(內部)"與"Outside(外部)"區域。人數統計的規則要求人頭的移動軌跡要穿過黃色區塊-代表人頭必須先出現在藍色的區域,接著再進入黃色的區域,最後再離開黃色區域回到藍色區域。
人數統計規則根據在黃色區域的進出入位置來決定人員的移動軌跡是進入、離開或經過(舉例,黃色區域的邊界點)。以下將細部說明如何定義進入、離開或經過。

- 進入(Walk-in)
下圖中,黑色線代表人體頭部的移動軌跡,在黃色區域範圍內從下往上移動。人頭從藍色區域移動黃色區域內,接著再走回藍色區域,形成兩個交點:A 和 B。
- A 點,軌跡進入黃色區域的位置,位於外部區域。
- B 點,軌跡離開黃色區域的位置,位於內部區域。
因此,此人被視為從外部區域進入,並從內部區域離開,此將計算為訪客進入1次 (Walk-in +1)。

- 離開(Walk-out)
下圖中,黑色線代表人體頭部的移動軌跡,在黃色區域範圍從上往下移動。
- A 點,軌跡進入黃色區域的位置,位於內部區域。
- B 點,軌跡離開黃色區域的位置,位於外部區域。
因此,人體會被識別為從內部進入,並從外部離開,此將計算為訪客離開1次(Walk-out +1)。

- 經過(Pass-by)
下圖中,黑色線代表人體頭部的移動軌跡,在黃色區域範圍從左往右移動。
- A 點,軌跡進入黃色區域的位置,位於外部區域。
- B 點,軌跡離開黃色區域的位置,位於外部區域。
因此,該移動行為會被識別為從外部進入,並從外部離開,此將計算為1次經過(Pass-by +1)。
雖然人頭跨越紅線並進入內部區域,仍然停留在黃色區域內,並沒有從內部邊界出來,而是從外部邊界出來。因此,這樣的行動軌跡不會被識別為訪客進人,而是識別為訪客經過。

備註:
人數計算規則要求移動軌跡必須穿越黃色區域,而不是只停留在黃色區域內。在黃色區域和藍色區域邊緣之間保留一些空間至關重要,這樣系統才能識別完整的行程。
目標在黃色或藍色區域內的行為對系統而言是不重要的。它只考慮到黃色區域的進入點和離開點,並判斷這些點位是在黃色區域的內部或外部區域。
- 從外部進入,從內部離開 → 判定為 進入
- 從內部進入,從外部離開 → 判定為 離開
- 從外部進入,從外部離開 → 判定為 經過
- 從內部進入,從內部離開 → 無效數據
- 在黃色區域中突然出現,進入點未知;無論出口點位於哪 → 無效數據
- 進入黃色區域但突然消失,離開點位未知 → 無效數據
- 僅在藍色區域內移動且未進入黃色區域 → 無效數據
步驟 4. 選擇開啟時段,接著點擊套用。

步驟 5. 將這些設定套用到其他設備,點擊複製到其他設備。點擊要套用設定的設備。

步驟 6. 回到應用程式 > 人數統計檢視每個站點的人流變化。

- 選擇站點:於頁面右上方。不同站點間的資料是隔離的,且進行即時計算。(計算依循相關的統計演算法,而非簡易的聚合結果。)
- 今日人流統計:顯示組織所在時區的午夜到當前時間的統計數據,每 15 分鐘一個數據點(計算已完成的 15 分鐘區間的數據,未完成的區間數據不顯示)。這些數據包含經過、進入、離開和進入率,每分鐘自動更新。
- 今日訪客數:此模組顯示即時的訪客數量。此外除了今日訪客數量趨勢圖外,還包含了目前的訪客流量、今日最高訪客流量,以及今日客流量高峰相較昨日的成長率。資料每分鐘會自動更新。
- 時間:時間的選擇方式包含自訂時間,您可以指定每日的起始和結束時間,最小間隔為半小時。您也可選擇開始時段,此模式依據每台設備設定的運作時間計算資料。日期選擇包含:日、週、月、年和自訂多種模式。
- 統計數據:包含經過、進入、離開、進入率以及相對應的同時期增長數據。
- 趨勢:圖表依據時間的選擇模式呈現,包含的數據為經過、進入、離開和離開率。您可以將圖表切換為按站點劃分的人流資訊。
- 表單模式和資料匯出:除了圖表顯示功能外,您還可以在圖表右上角切換至表單模式。在表單模式中可以將資料匯出。

安裝小技巧
攝影機安裝說明
為確保最佳的運作和準確的人數統計,請遵循以下的建議安裝:
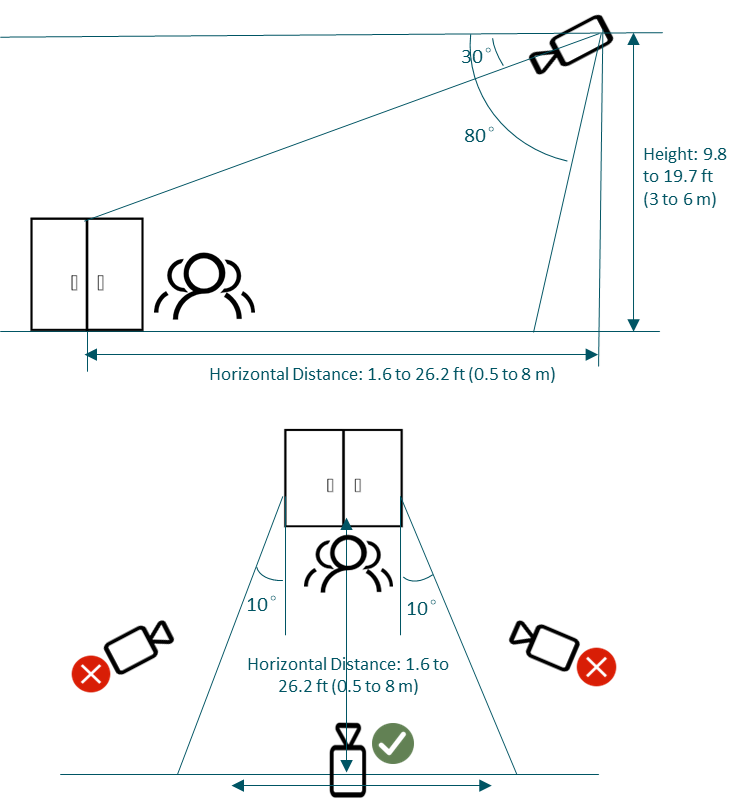
1) 攝影機安裝高度
攝影機與地面的垂直距離應在 3~6 公尺之間。
2) 攝影機傾斜角度
攝影機的視線與水平面的向下視角應為 30°~80°。
3) 攝影機安裝位置
攝影機的安裝位置建議直接面對入口或出口處。避免攝影機以傾斜角對準目標區域。
4) 安裝方式
攝影機的高度、傾斜角度和位置必須協調一致,以避免遮蔽畫面中的人體頭部。不當的設置可能會導致計數遺漏或錯誤。
建議佈署狀態
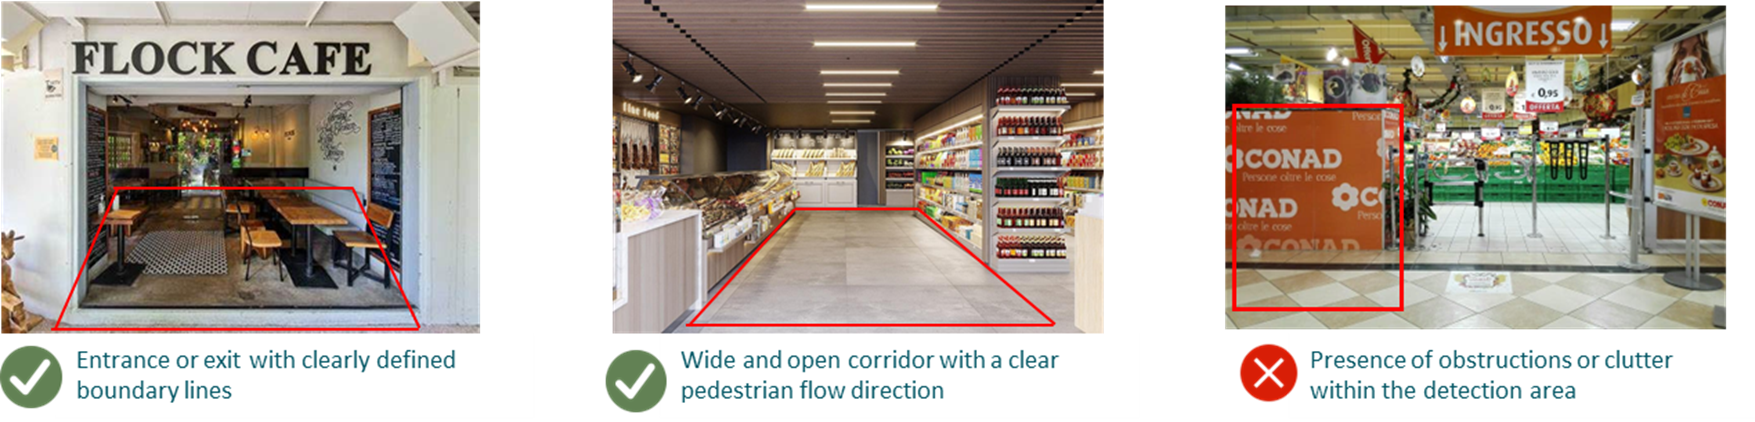
1) 安裝在開放及視野清晰的空間
建議位置為入口處、走廊或視野清晰的開放空間,以及人流方向明確的開放空間。
2) 確保適當的光照
避免在光照不足、背光、強光或過曝的環境中使用。為了獲得最佳的偵測準確度,請在白天或光線充足的區域使用-強烈建議不要在夜間紅外線(IR)模式狀態使用。
3) 避免偵測區域內太過雜亂和陰影的現象
盡量避免場景中過於混亂、物體重疊或陰影分散,因為這些因素皆可能會干擾偵測的過程。
4) 保持偵測區域不受障礙物干擾
請勿將攝影機安裝在可能阻擋或阻礙偵測區域內行人的位置。
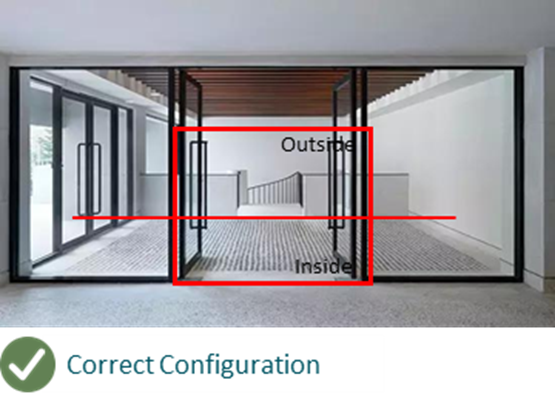
人數統計區域設定需求
1) 確定人流方向
根據現場的佈署確定客流量的進入或離開的方向。
2) 定義偵測區域和計算規則
畫出偵測區域並設定進入/離開的規則。確保偵測範圍涵蓋所有目標區域,包含內部和外部區域。
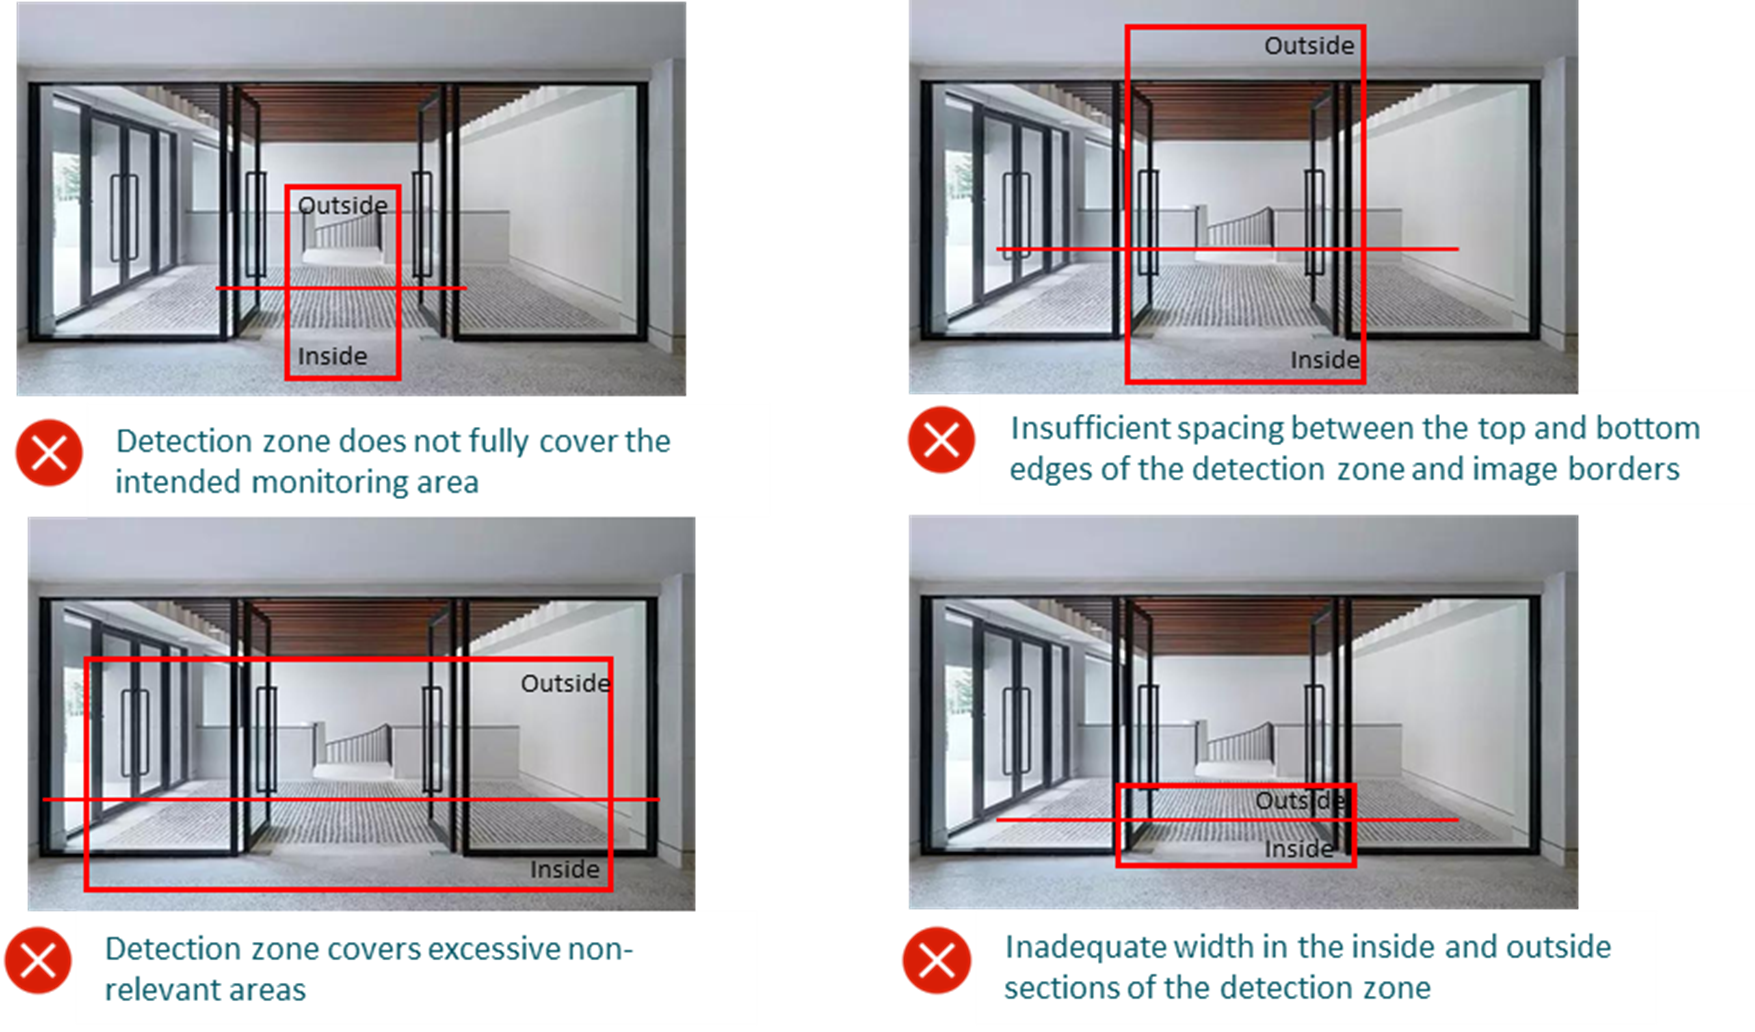
3) 垂直邊距
在偵測區域範圍的頂部/底部與攝影機的視野範圍邊緣保留一些間隔。建議最少保留一個人頭的空間(大約 0.5 公尺)。
4) 水平涵蓋範圍
確保在在偵測區域內的室內和戶外兩側都有足夠的空間。每邊至少都保留 4 個人頭的寬度以確保計算功能的運作順暢。
5) 區域最佳化
偵測區域的大小應適中-避免過大或包含不相關的區域。過大的偵測區域可能會產生不受控的變因,從而對偵測的準確度產生影響。
結果
依上述的步驟,您已在 Omada Central 完成人數統計功能設置。
如需更多詳細資訊,請參考下載中心 下載您的產品手冊。
這篇faq是否有用?
您的反饋將幫助我們改善網站


