Monitoring and Managing the Network (Pharos Control)
CHAPTERS
1. Monitor and Manage the Devices
|
|
This guide applies to: Phaos Control 2.0. |
This guide introduces how to monitor and manage the network using Pharos Control:
1. Monitor and Manage the Devices
2. Manage the Firmware Files
3. Configure Scheduled Tasks
4. Configure Trigger Rules
The following parts detailedly introduces these features.
1Monitor and Manage the Devices
This chapter introduces how to monitor and manage the devices. First, you need to add the devices to be managed in Pharos Control. For detailed instructions, refer to Quick Start Guide. You can also group these devices according to your need. And then you can monitor the devices, and centrally manage them, such as reboot, upgrade and ping the devices. In addition, Pharos Control provides the map feature. With this feature, you can visually manage the devices on the map.
The following sections introduce how to group, monitor and manage the devices, and how to use the map feature to facilitate your management.
1.1Group the Devices
When there are a number of devices in the network, it is recommended to group these devices for efficient management and fast search. Pharos Control provides two kinds of groups: Auto group and Manual group. And in Auto group, there are two default groups: Managed and Unmanaged. The managed devices are in the Managed group, and the unmanaged devices are in the Unmanaged group. You can manually create more groups as needed. There are two methods:
Auto Grouping: You can set the rules to automatically group the devices. For example, you can create an Auto group and set a rule that all the devices with a same SSID will be added to this group automatically.
Manual Grouping: You need to manually add the devices to the corresponding group.
Auto Grouping
Follow the steps below to create a new group and set a rule to automatically add the devices to this group:
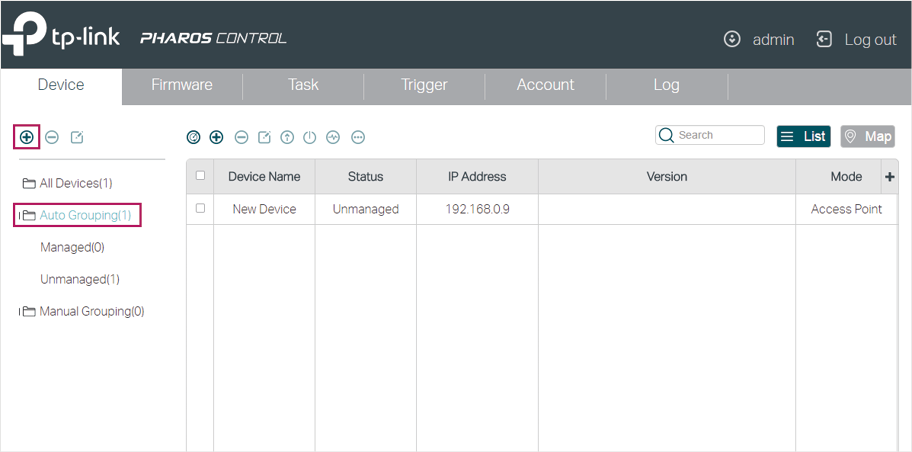
1)Go to the Device page. Click Auto Grouping and click .
Figure 1-1 Auto Grouping Page
2)In the pop-up window, specify a name for the new group and set one or more rules for this group. Click OK, and the devices matching the rules above will be added to the group automatically.
Figure 1-2 Adding a Group
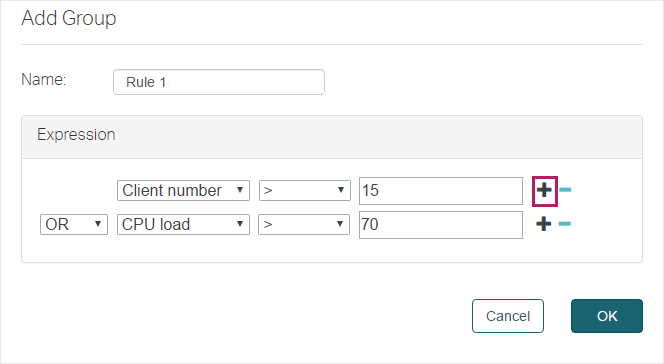
For example, here we add two rules: “the client number is larger than 15” and the “CPU load is larger than 70%”. Then we choose “OR“ as the logical relation between the two rules, which means that a device will be automatically added to this group when meeting either one of the rules. Also you can select “AND“ which means that a device will be automatically added to this group when it meets both the rules. You can click to add more rules and click
to delete the rule.
There are six types of matching rules:
|
contains |
It is used to compare the strings, such as device name, product, IP address and version. When the real string contains the specified consecutive string, the match of this rule is successful. |
|
startswith |
It is used to compare the strings, such as device name, product, IP address and version. When the real string starts with the specified consecutive string, the match of this rule is successful. |
|
= |
It is used to compare both the strings and numbers. When the real string or number is completely the same as the specified one, the match of this rule is successful. |
|
!= |
It is used to compare both the strings and numbers. When the real string or number is not the same as the specified one, the match of this rule is successful. |
|
> |
It is used to compare the numbers, such as SNR, Tx rate, CPU load and Memory usage. When the real number is larger than the specified one, the match of this rule is successful. |
|
< |
It is used to compare the numbers, such as SNR, Tx rate, CPU load and Memory usage. When the real number is smaller than the specified one, the match of this rule is successful. |
Manual Grouping
Follow the steps below to create a new group and add the specific devices to this group:
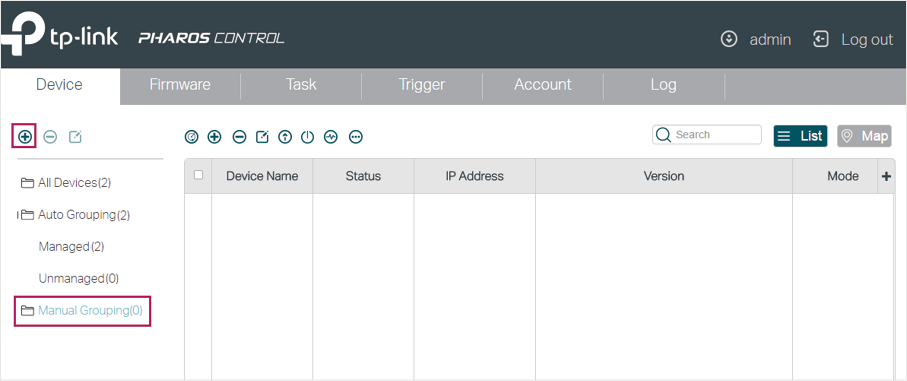
1)Go to the Device page. Click Manual Grouping and click .
Figure 1-3 Manual Grouping Page
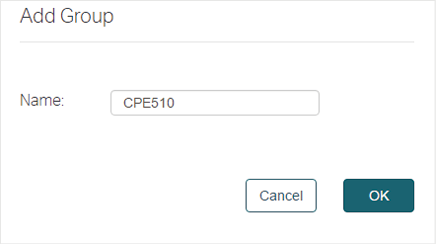
2)In the pop-up window, specify a name for the new group and click OK.
Figure 1-4 Adding a Group
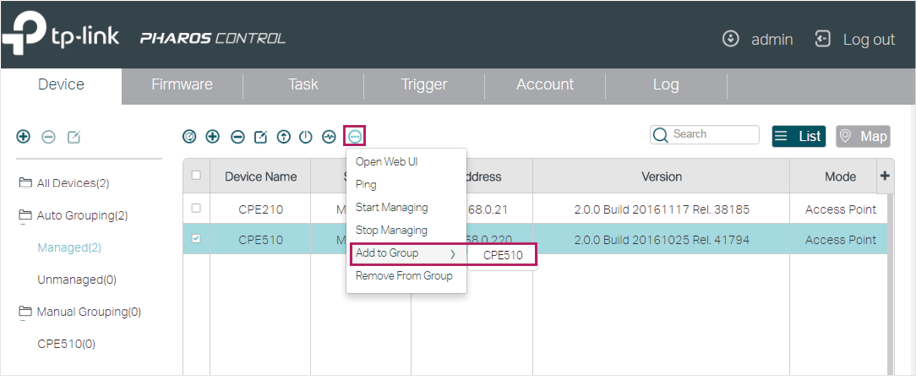
3)Select your desired devices to be added to the new group. Click , move your mouse to Add to Group and select the new group.
Figure 1-5 Adding a Device to Group
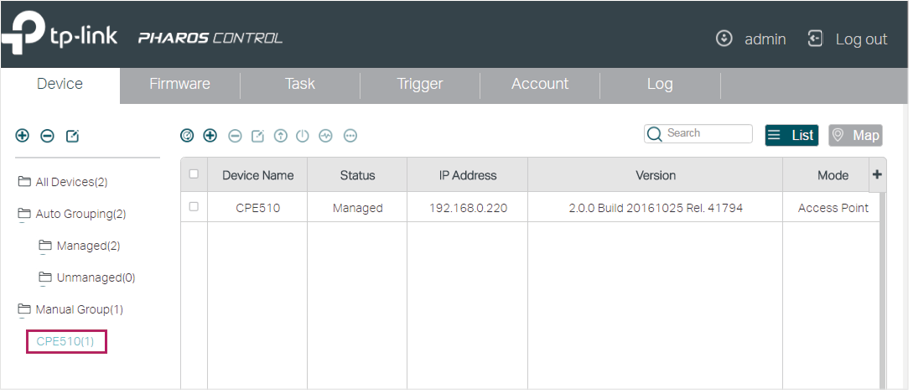
4)Then the selected devices will be added to the new group. You can enter the group to check the configuration result.
Figure 1-6 Checking the Configuration Result
1.2Monitor the Devices
With Pharos Control, you can monitor the information and status of the devices. What’s more, Pharos Control provides real-time graphic data displaying of the devices. The following sections introduce how to view the information and the real-time graphic data of the devices.
View the Device Information
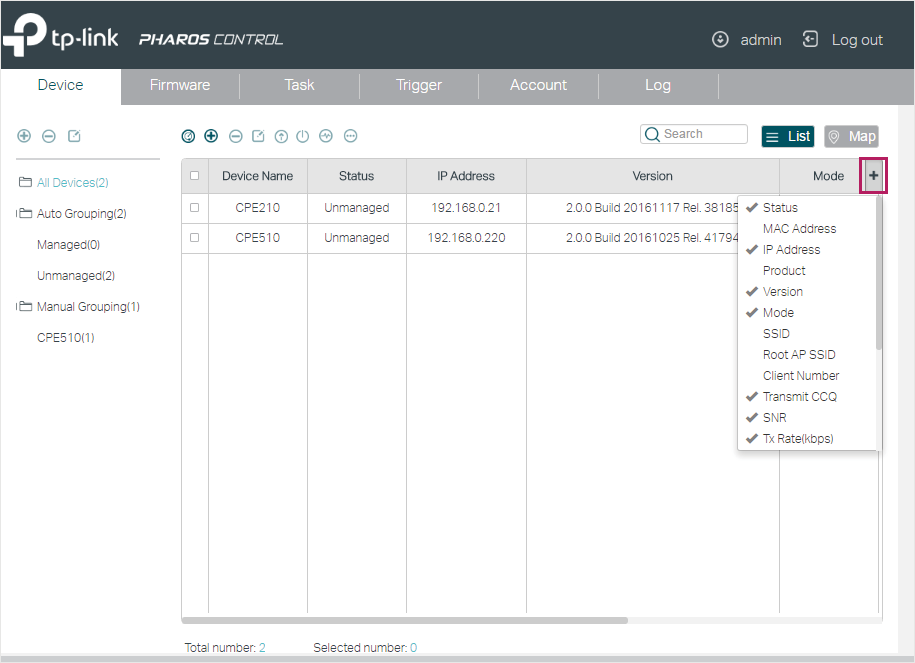
With Pharos Control, you can view the information of each device. Double click the device and the information will be displayed in the pop-up window. Also, you can view the information directly in the table. Because of the limited space of the page, you may need to drag the slider at the bottom to view all the information options. You can also customize the displayed options by clicking and enabling your desired options.
Figure 1-7 Enabling the Options
The following table introduces all the information options:
|
Device Name |
Displays the name of the device. For the automatically discovered devices, the device name is the product model. For the manually added devices, the device name is New Device. Only when a device’s status is Managed will the device name change to the product model. |
|
Status |
Displays the status of the device. Unmanaged: The device cannot be managed by Pharos Control. It is the initial status of the device. Also, when the managed device is down or disconnected to Pharos Control, the status will change from Managed to Unmanaged. Managed: The device is being managed by Pharos Control. Connecting: Pharos Control is trying to connect and manage the device. Upgrading: The device is being upgraded. Rebooting: The device is being rebooted. Connection Failed: Pharos Control is failed to connect the device when trying to manage the device. Invalid Credentials: Pharos Control is failed to manage the device because of incorrect username, password or port number. |
|
MAC Address |
Displays the MAC address of the device. |
|
IP Address |
Displays the IP address of the device. |
|
Product |
Displays the model and hardware version of the device. |
|
Version |
Displays the software version of the device. |
|
Mode |
Displays the working mode of the device, including Access Point, Client, Repeater, Bridge, AP Router and AP Client Router. |
|
SSID |
Displays the SSID of the device. |
|
Root AP SSID |
Displays the SSID of the device’s root AP when it is in either of the following modes: Client, Repeater, Bridge and AP Client Router. |
|
Client Number |
Displays the number of the wireless clients connected to the device. |
|
Transmit CCQ |
Displays the transmission quality of the clients connected to the device. Here CCQ refers to Client Connection Quality. |
|
SNR |
Displays the Signal-Noise Ratio of the device. |
|
Tx Rate (kbps) |
Displays the rate of sending data of the device. |
|
Rx Rate (kbps) |
Displays the rate of receiving data of the device. |
|
Tx Total |
Displays the total data traffic sent by the device. |
|
Rx Total |
Displays the total data traffic received by the device. |
|
CPU Load (%) |
Displays the CPU usage of the device. |
|
CPU Frequency (MHz) |
Displays the CPU frequency of the device. |
|
Memory Usage (%) |
Displays the memory usage of the device. |
|
Memory Size (MB) |
Displays the memory size of the device. |
|
Description |
Displays the description of the device. |
View the Real-time Graphic Data
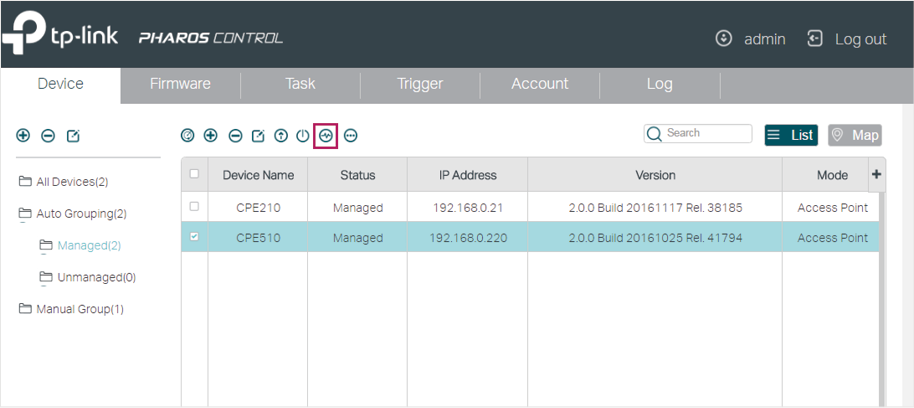
Pharos Control can collect the real-time data of the managed devices and display it graphically. Follow the steps below to monitor the graphic data information of the device:
1)Select your desired device to be displayed, and click .
Figure 1-8 Selecting the Devices
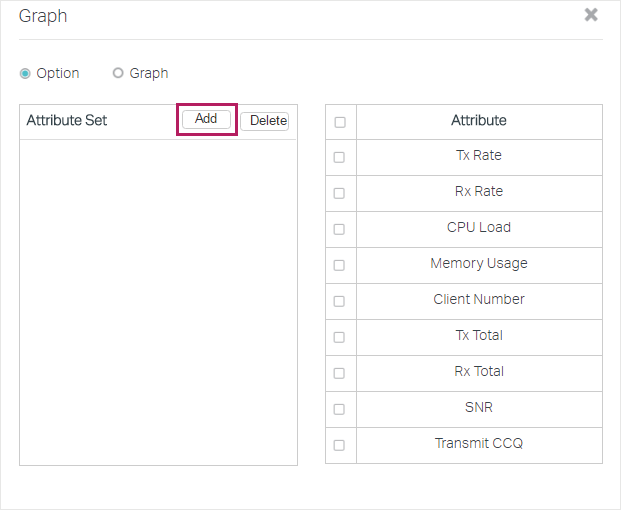
2)In the pop-up window, click to create a graphic template.
Figure 1-9 Creating a Graphic Template
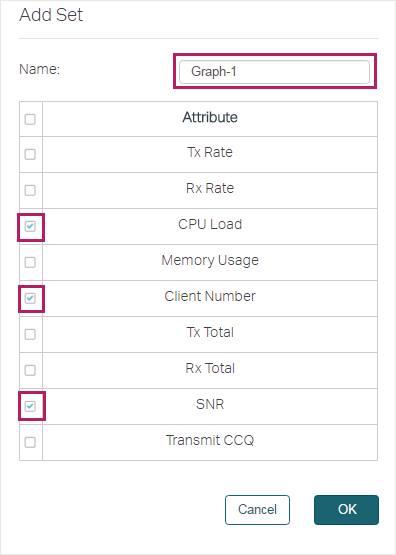
3)In the pop-up window, specify a name for the template and select the information options which will be displayed in the graph. For example, we specify the template name as Graph-1, and select CPU Load, Client Number and SNR to be displayed. Click OK.
Figure 1-10 Specifying the Parameters of the Template
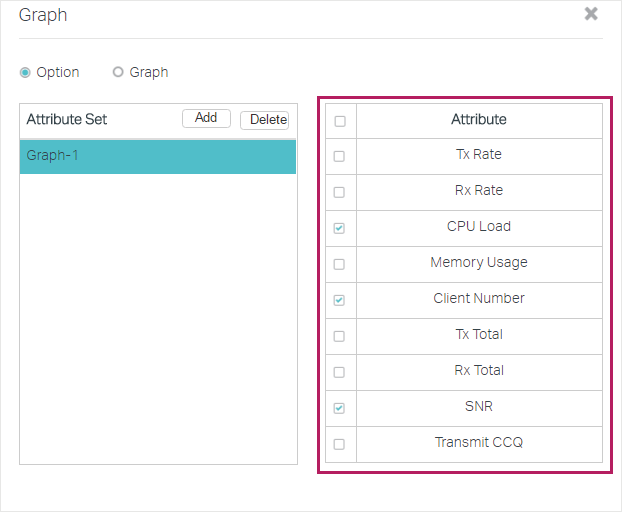
4)The template is created. You can add more templates or delete the unused templates on this page. Also, you can edit the displayed information options in the right-hand column by checking or unchecking the boxes.
Figure 1-11 Graphic Template Page
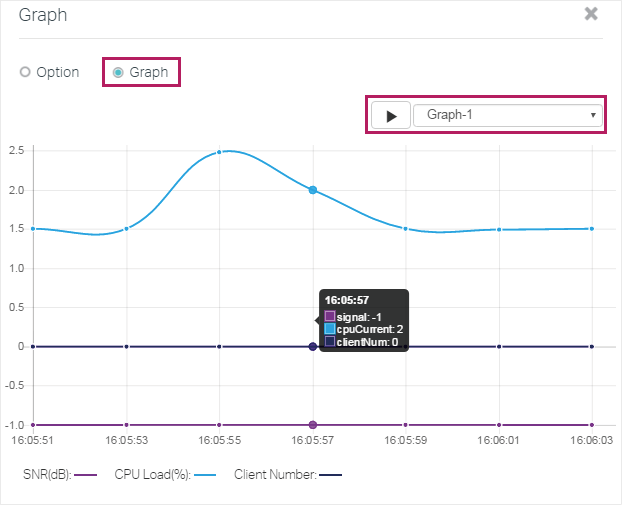
5)Click the Graph button to enter the following page. Select a template and click to start the dynamic real-time monitoring. The horizontal axis displays the time, and the vertical axis displays the values. You can click
to stop the dynamic displaying, and move your mouse to any of the curves to view the data information at a specific time. For example, at 16:05:57 of the day, the SNR is -1 dB, the CPU load is 2% and no client is connected to the device for the time being.
Figure 1-12 Starting the Dynamic Real-Time Monitoring
1.3Manage the Devices
With Pharos Control, you can centrally manage your Pharos devices. The following sections introduce how to configure, upgrade, reboot and ping the devices, and how to open their management web pages.
|
|
Note: The following operations can be executed only on the devices in Managed status: configuring, upgrading, rebooting and opening the web page. |
Configure the Devices
Follow the steps below to configure the devices.
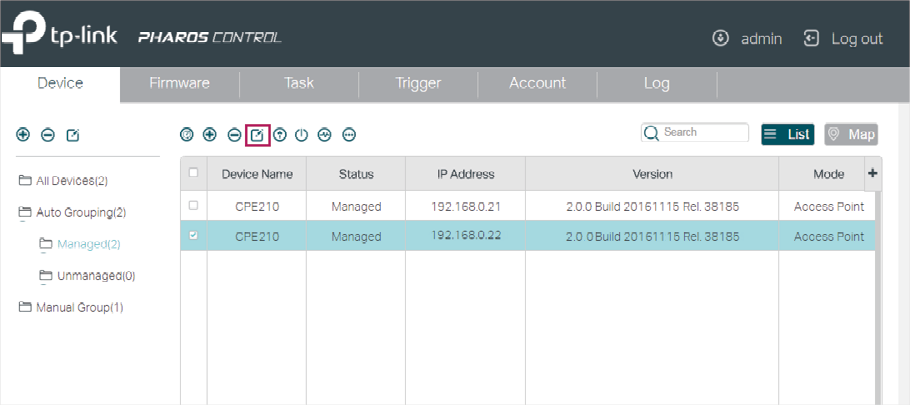
1)Select your desired device and click . If you want to upgrade devices in batch, make sure that these devices can be upgraded with the same firmware file.
Figure 1-13 Configuring the Devices
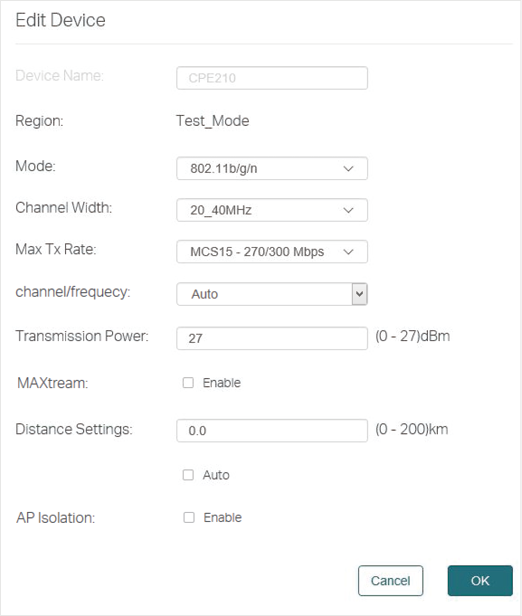
2)In the pop-up window, configure the basic parameters of the device and click OK.
Figure 1-14 Configuring the Basic Parameters
|
Device Name |
Displays the name of the device. |
|
Region |
Displays the region of the device. |
|
Mode |
Select the IEEE 802.11 mode the radio uses. The available options vary with the product models. With a frequency band of 2.4GHz, CPE210/CPE220/WBS210 supports five wireless modes: 802.11b, 802.11g, 802.11n, 802.11b/g and 802.11b/g/n. You are recommended to set the 11b/g/n mixed mode, and all of 802.11b, 802.11g and 802.11n wireless stations can connect to the device. CPE510/CPE520/WBS510 has a frequency band of 5GHz, supporting 802.11a, 802.11n and 802.11a/n modes. We suggest to set in 11a/n mode, allowing both 802.11a and 802.11n wireless stations to access the device. |
|
Channel Width |
Select the channel width of the device. Options include 5MHz, 10MHz, 20MHz and 20/40MHz. According to IEEE 802.11n standard, using a channel width of 40MHz can increase wireless throughput. However, you may choose lower bandwidth due to the following reasons: Increase the available number of channels within the limited total bandwidth. To avoid interference from overlapping channels occupied by other devices in the environment. Lower bandwidth can concentrate higher transmit power, increasing stability of wireless links over long distances. Subject to the channel width of root AP in Client/ Bridge/ Repeater/ Client Router operation modes. |
|
Max Tx Rate |
Select the maximum data transmission rate. |
|
channel/frequency |
Select the channel used by the device to improve wireless performance. This setting is only available in the modes of Access Point and AP Router. We recommend you use the Spectrum Analysis tool to select a proper channel. |
|
Transmission Power |
Specify the transmit power value. The valid values vary with the prodct models and regions. |
|
MAXtream |
Enable or disable MAXtream. This feature is only available in the modes of Access Point and AP Router. MAXtream is a proprietary technology of TP-Link for Wi-Fi system. It is based on TDMA (Time Division Multiple Access) so that data streams are transmitted in strict order. MAXtream aims to maximize throughput and minimize latency especially in a multi-STAs circumstance. “Hidden nodes” problem can also be eliminated with MAXtream enabled. We recommend you turn on MAXtream in a large scale wireless deployment to achieve better performance. Note: MAXtream Technology is only compatible with Pharos series products. You cannot connect other Wi-Fi devices to an AP with MAXtream enabled. |
|
Distance Settings |
Specify the distance between AP and Station. If this device serves as a client, the value is the distance between this device and the root AP. If this device serves as an AP, the value is the distance between the farthest client and this AP. You can manually enter the value or enable the Auto option. Manual: Enter the distance manually in the input box. The value is limited to 0-200km, and we recommend you set the value to 110% of the real distance. Auto: Check the Auto option, then the system will dynamically detect the distance. This function is available only when the distance is less than xx kilometers. The value xx varies according to the channel width you set. CPE210 does not support this option. |
|
AP Isolation |
Enable or disable AP Isolation. AP Isolation is used to isolate all wireless stations connected to this device so that they cannot communicate with each other. This function will be disabled if WDS/Bridge is enabled. |
Upgrade the Devices
Follow the steps below to upgrade the devices.
1)Import the firmware files. For details, refer to 2. Manage Firmware Files.
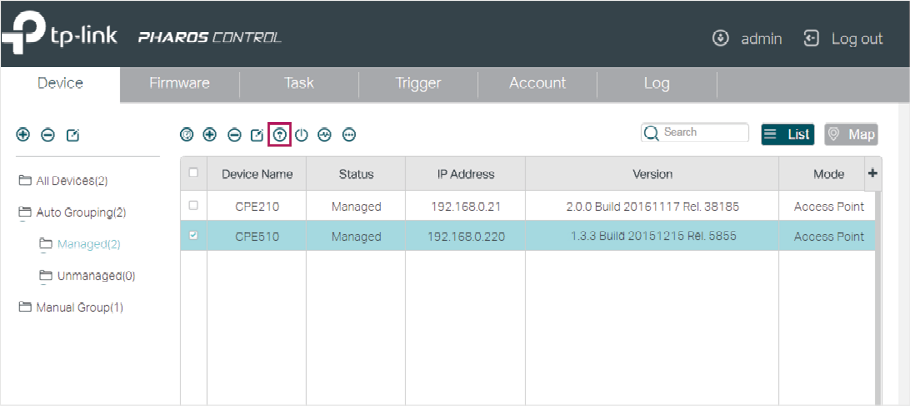
2)Select your desired device and click . If you want to upgrade devices in batch, make sure that these devices can be upgraded with the same firmware file.
Figure 1-15 Upgrading the Devices
3)In the pop-up window, select the appropriate firmware file from the drop-down list, and click OK.
Figure 1-16 Selecting the Firmware
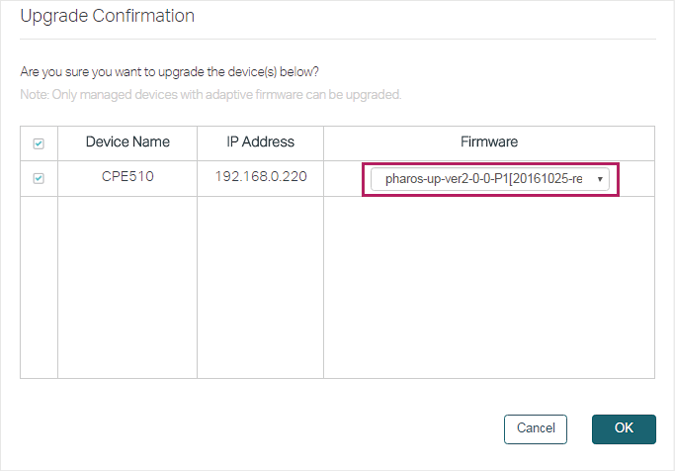
4)Then the device status will change to Upgrading. Wait for a while without any operation, and the device will be upgraded automatically.
Figure 1-17 Displaying the Status
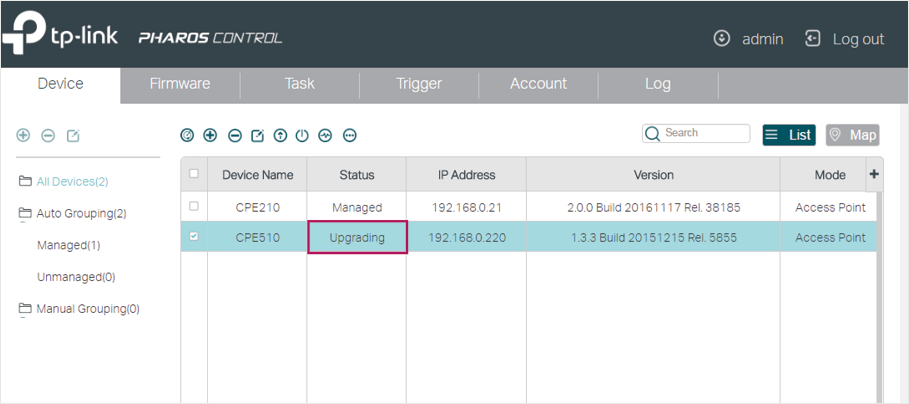
Reboot the Devices
Follow the steps below to reboot the devices:
1)Select one or more devices and click .
Figure 1-18 Selecting the Devices
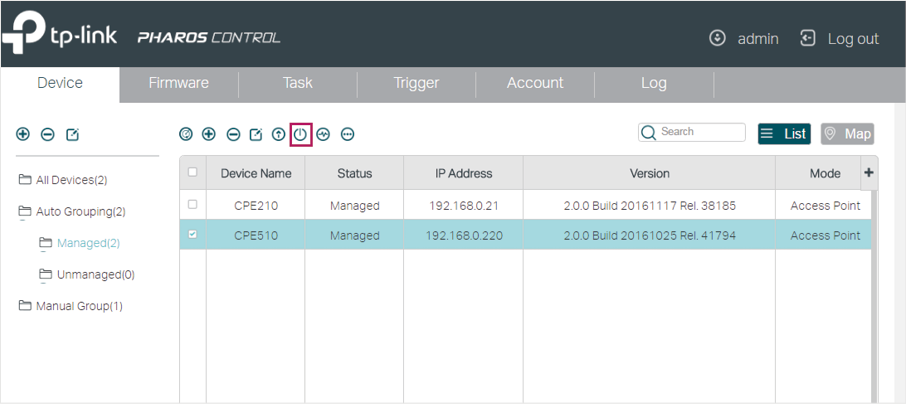
2)In the pop-up window, verify the device to be rebooted and click OK. Wait for a moment and the device will reboot automatically.
Figure 1-19 Verifying the Device
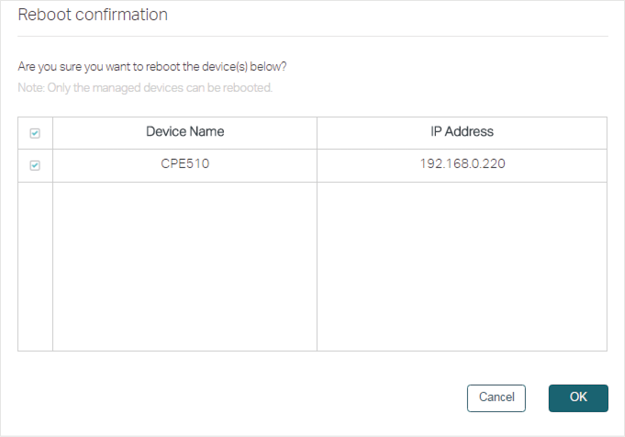
Ping the Devices
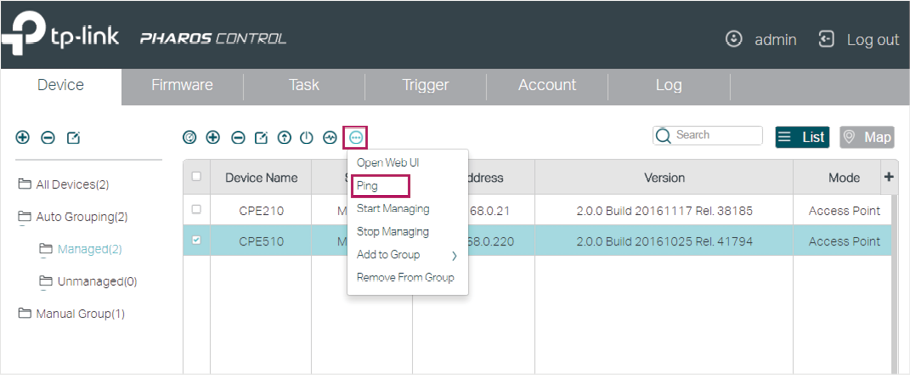
If you want to test the connectivity between Pharos Control and the devices, you can use the Ping feature. Follow the steps below to ping the devices.
1)Select your desired device, click and select Ping in the drop-down menu.
Figure 1-20 Selecting the Devices
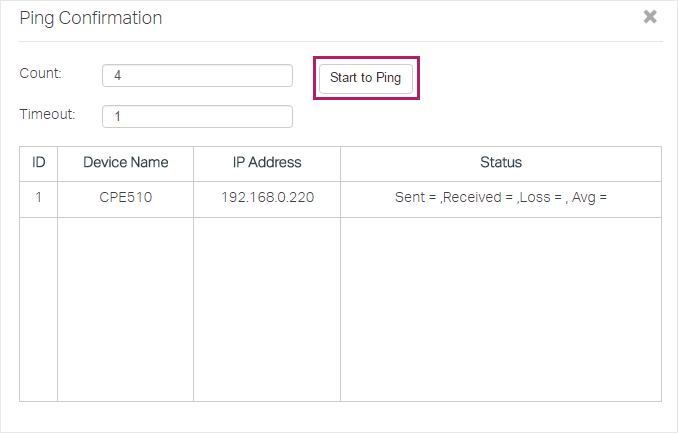
2)In the pop-up window, set the number of ping packets to be sent and the timeout value. Timeout value determines how long Pharos Control will wait for the response from the device before the ping is regarded as failed. Click Start to Ping.
Figure 1-21 Starting to Ping
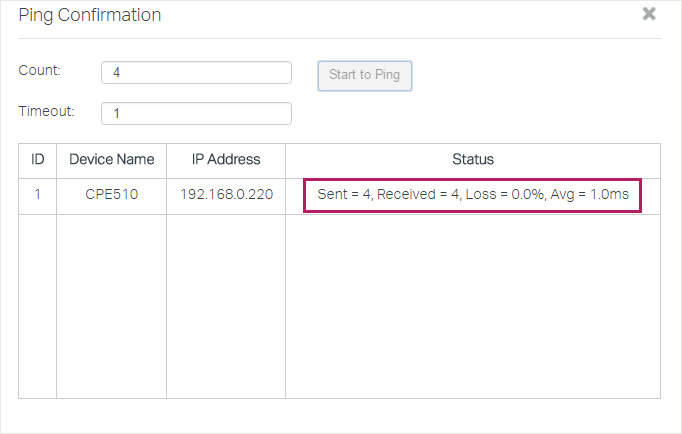
3)View the ping result in the Status column. As the following figure shows, Pharos Control sent 4 ping packets to the device and a response was received from the device every time, which indicates that the connection between Pharos Control and the device is normal.
Figure 1-22 Viewing the Ping Result
Open the Web UI of the Device
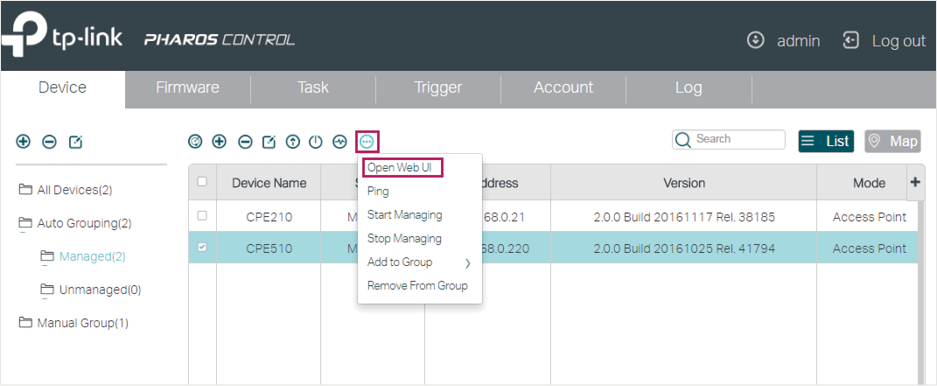
You can open the web UI of each device under management. Select your desired device, click and select Open Web UI in the drop-down menu. And then the web UI of the device will then open.
Figure 1-23 Opening the Web UI
1.4Monitor and Manage the Devices on Google Map
With this feature, you can drag your devices to their actual locations on the Google map, and visually monitor and manage these devices. Go to the Device page and click . Then the map page will appear.
Figure 1-24 Map Page
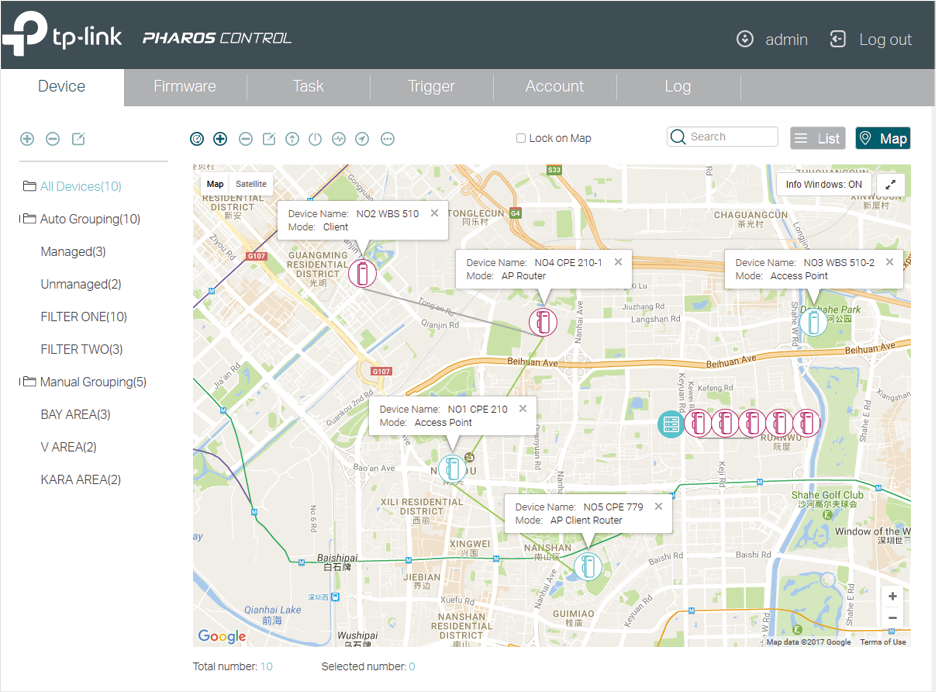
All devices are on the map. You can drag these devices to the appropriate locations according to their actual locations. Also, you can select one or more devices on the map, and do the operations introduced in the above sections, such as group the devices, view the graphic data information of the devices, and upgrade, ping, and reboot the devices.
The following table shows all icons and sub-functions on the map.
|
|
It represents Pharos Control. |
|
|
It represents the device that is not being managed. |
|
|
It represents the device that is being managed. |
|
Green Line Between Two Devices |
It indicates the connection between the two devices is normal. |
|
Gray Line Between Two Devices |
It indicates the connection between the two devices is failed. |
|
|
To view the terrain on the map, click Map and check Terrain to enable the terrain display. |
|
|
Google provides satellite map, and you can click Satellite to change the current map to a satellite map. |
|
|
Click this button to set whether the information tag will be displayed at the top of the device icon. The tag displays the name and mode of the device. |
|
|
Click this button to view the map in full screen. |
|
|
Click this button to zoom in and out the map. |
|
|
Check this option to lock the devices on the map, which means that the devices cannot be moved with this option enabled. |
Firmware is released to upgrade the devices. To centrally and conveniently manage firmware, you can download firmware files from our website and import them to Pharos Control.
Follow the steps below to manage firmware files in Pharos Control:
1)Go to the Firmware page, and click .
Figure 2-1 Firmware Page

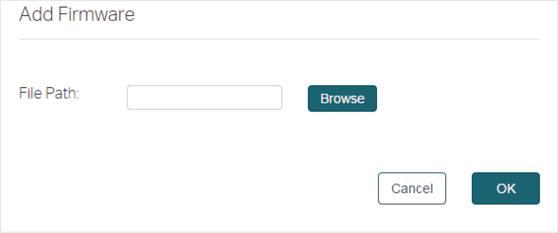
2)The following window will pop up. Click Browse, choose a firmware file from your local host, and click OK.
Figure 2-2 Choosing a Firmware
3)In the same way, import all the firmware files to Pharos Control.
Figure 2-3 Importing the Firmware
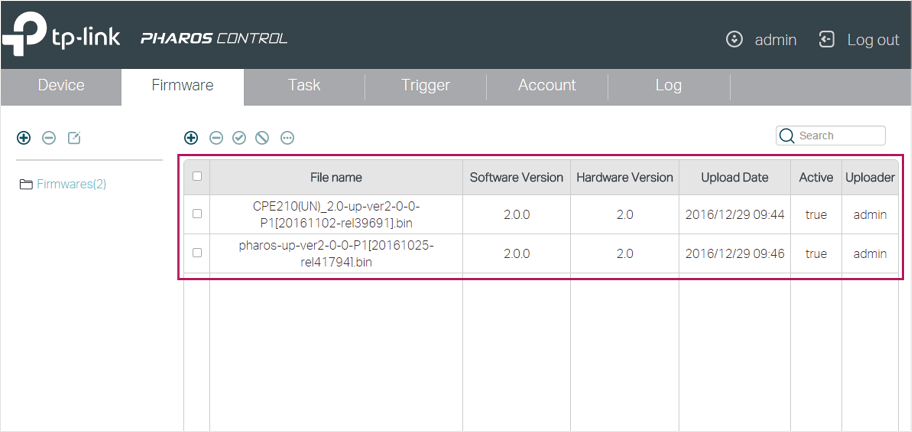
You can view the firmware information in the table.
|
File Name |
Displays the name of the firmware file. |
|
Software Version |
Displays the software version of the firmware. |
|
Hardware Version |
Displays the hardware version of the firmware. |
|
Upload Date |
Displays the date and time of uploading the firmware. |
|
Status |
Displays the status of the firmware entry. There are two kinds of statues: Active: The firmware file can be used to upgrade the devices. Inactive: The firmware file is forbidden to upgrade the devices. You can select one or more firmware entries and click |
|
Uploader |
Displays the username of whom uploaded the firmware. |
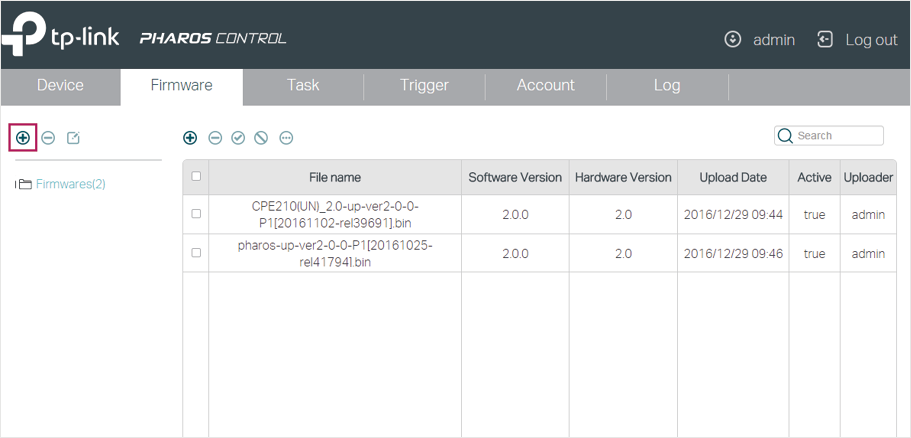
4)By default, all the firmware files are in the default group named Firmwares. If needed, you can create more groups to classify the firmware files. To add a new group, click in the left column.
Figure 2-4 Adding a New Group
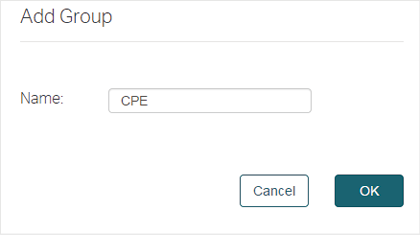
5)The following window will pop up. Specify a name for the group and click OK.
Figure 2-5 Specifying a Name
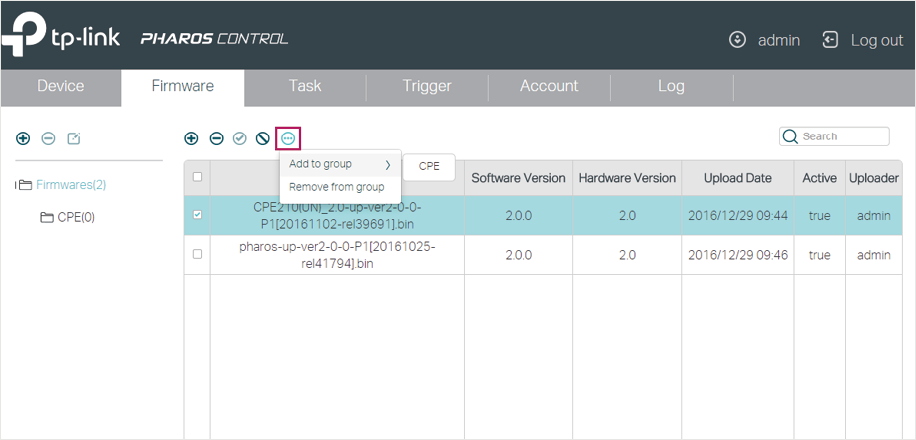
6)Select one or more firmware entries, click , move your mouse pointer to Add to group, and select the new group.
Figure 2-6 Selecting a New Group
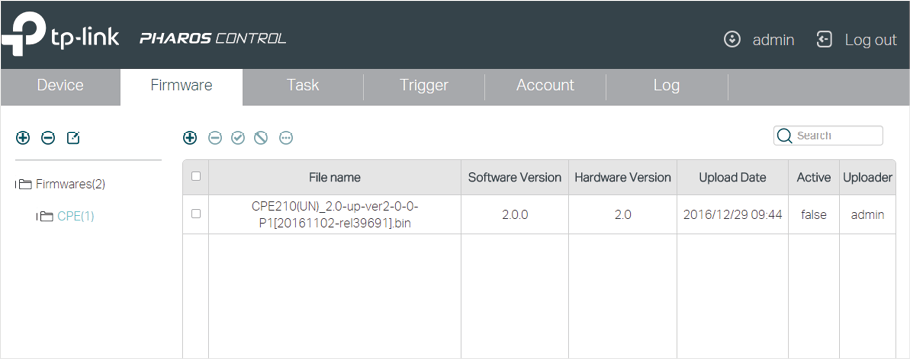
7)Click the group name in the left column, and you can view the group member we just added to this group.
Figure 2-7 Viewing the Group Member
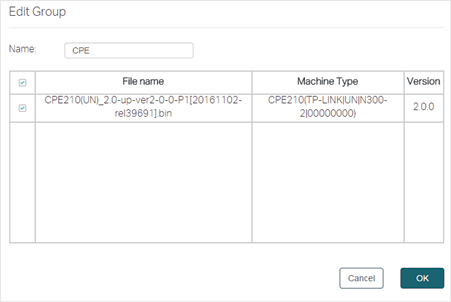
If you want to remove a firmware entry from a group, you can select the firmware, click and click Remove from the group. Also, you can delete or edit the group as the following table shows.
|
|
Click this button to delete the current group |
|
|
Click this button to edit the current group on the following window. You can select the firmware you want to keep in this group and then click OK. The deselected firmware will be removed from the group.
|
With this feature, you can set scheduled tasks for the devices and Pharos Control. For example, you can configure the managed devices to reboot every two weeks, or configure Pharos Control to discover the devices in the LAN at 8:00 am every day, which facilitates you manage your network.
Follow the steps below to configure scheduled rules.
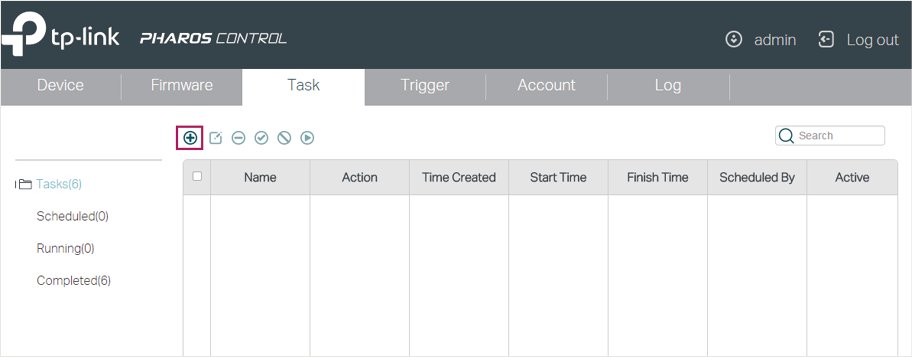
1)Go to the Task page. Click .
Figure 3-1 Task PAge
2)Then the following window will pop up.
Figure 3-2 Adding Schedule
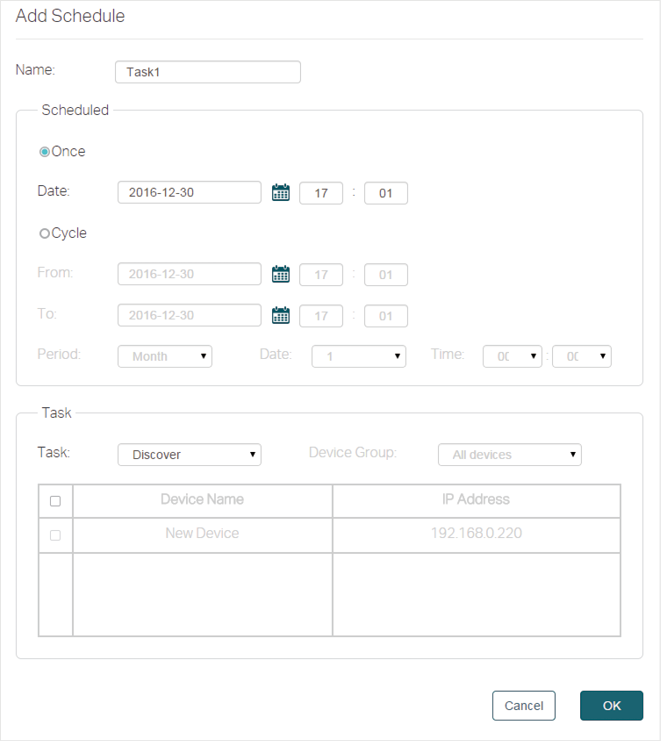
1. Specify a name for the task.
2. Configure the Scheduled parameters:
Figure 3-3 Configuring The Scheduled Parameters
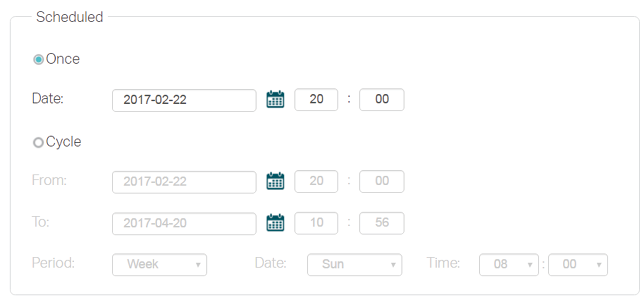
The following table introduces the configuration options.
|
Once |
Enable this option and specify a point in time. The task will be performed at the specified time. For example, the following configuration indicates that the task will be performed at 8pm on Feb 22nd, 2017. And the task will be performed only once.
|
|
Cycle |
Enable this option and specify a time range and the task interval. During the time range, the task will be performed at every interval. For example, the following configuration indicates that from Feb 20th, 2017 to Apr 20th, 2017, the task will be performed at 8 am each Sunday morning.
|
3. Select a task type and configure the corresponding options.
Figure 3-4 Configuring the Options
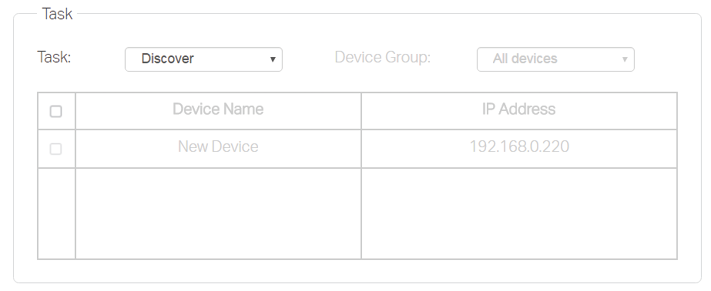
The following table introduces the task types:
|
Discover |
Pharos Control will discover the devices in the network at the scheduled time. |
|
Reboot |
Pharos Control will reboot the selected devices at the scheduled time. |
|
Firmware Upgrade |
Pharos Control will upgrade the selected devices using the specified firmware at the scheduled time. |
|
Manage |
Pharos Control will check whether the selected devices are currently being managed at the scheduled time. If not, Pharos Control will try to change the status of the devices from Unmanaged to Managed. |
4. Click OK.
This feature is used to inform you of a device status change via email and help you manage the devices automatically. For example, if a device with Managed status has an issue and changes to Unmanaged status, Pharos Control will try to manage this device again, and at the same time, send an email to the specific mailbox to inform you of this event.
Follow the steps below to configure the Trigger feature:
1)Go to the Trigger page and click .
Figure 4-1 Trigger Page

2)The following window will pop up. Configure the required options.
Figure 4-2 Adding Trigger
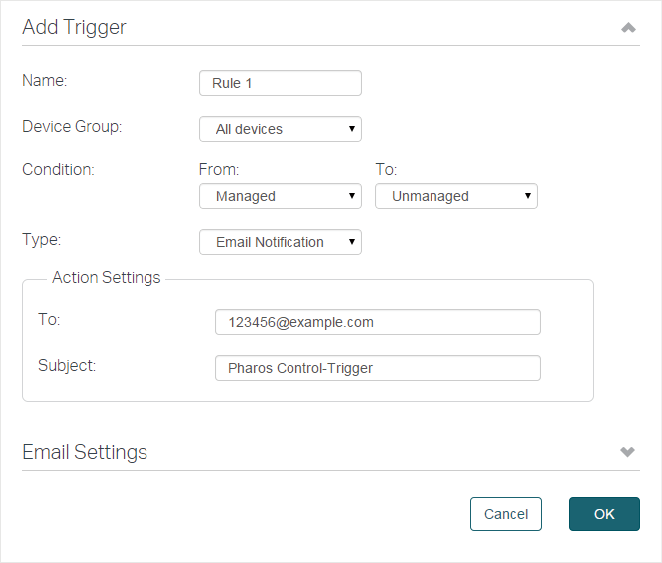
|
Name |
Specify a name for this trigger rule. |
|
Device Group |
Select a device group on which the rule will take effect. |
|
Condition |
Configure the trigger conditions. For example, if we choose From as Managed and To as Unmanaged, Pharos Control will send an email to the specific mailbox when the status of a device in the selected group changes from Managed to Unmanaged. |
|
Type |
If the condition From is selected as Managed, there are two types: Email Notification and Manage Device. If the condition From is selected as Unmanaged/Error, there is only one type: Email Notification. Email Notification: Pharos Control will send an email to the specific mailbox. Manage Device: Pharos Control will try to change the status of the device from Unmanaged/Error to Managed. |
|
Action Settings |
Set the email information. To: Set the recipient’s mailbox address. Subject: Set a subject for the email. |
3)Click the Email Settings tag to expand the following section. Fill in the mail server information according to your own details.
Figure 4-3 Specifying the Email Settings
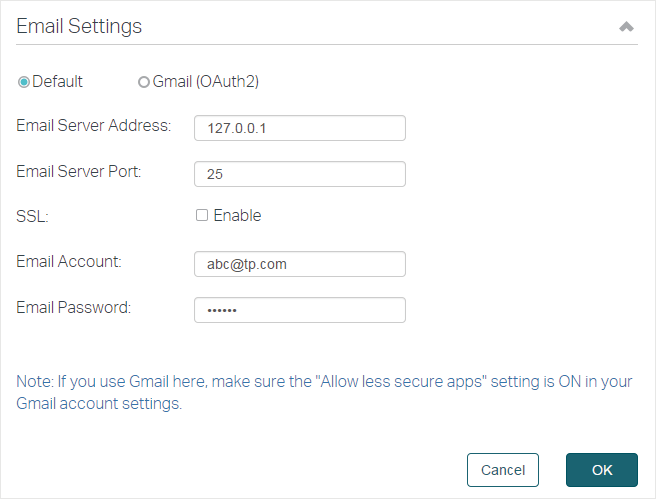
If you do not use a Gmail server to send the trigger email, select Default option, configure the following parameters, and click OK.
|
Email Server Address |
Enter the IP address of the email server. |
|
Email Server Port |
Enter the port of the email server. |
|
SSL |
Enable or disable SSL encryption. If your email server supports SSL encryption, we recommend that you enable this option to enhance the email security. |
|
Email Account |
Enter the email account. |
|
Email Password |
Enter the email password. |
If you use a Gmail server to send the trigger email, there are two configuration methods.
Method 1:
1. Complete the configurations as shown above.
2. Turn on “Allow less secure apps“ option in your Gmail account settings. You can click the note with blue color on the page to quickly access the Gmail website.
Method 2:
1. Select Gmail (OAuth2) option.
Figure 4-4 Selecting Gmail (OAuth2) Option
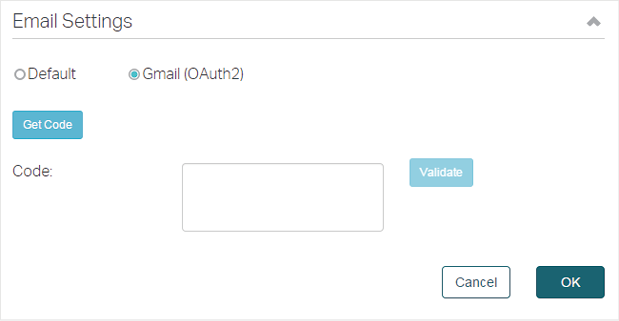
2. Click Get Code, and you will be directed to the Gmail website.
3. Log in to your Gmail account and copy the received code to the Code area on the above page.
4. Click Validate to check whether the code is valid. If an error is displayed, check whether the code is correctly copied and try again. If a green tick is displayed, just click OK to save your settings, and Pharos Control will use your Gmail account to send the trigger emails.
4)To verify whether the email settings are correctly configured, select the rule you just created, and click to do a test. Pharos Control will send an email to the recipient’s mailbox via the email server. You can check whether an email is received in the recipient’s mailbox. If does, the Trigger feature works normally.
Figure 4-5 Testing the Settings
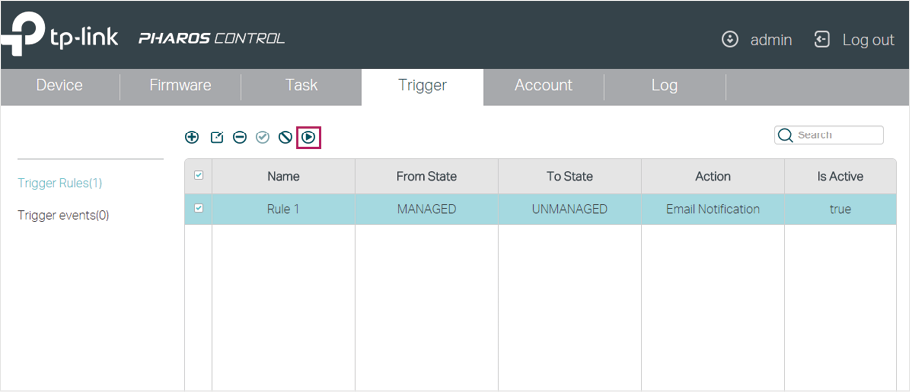
5)After all the configurations above are completed, you can use this feature without any other operations. If needed, you can also manage the trigger rules and view the trigger events on the this page.
Manage Trigger Rules
Figure 4-6 Managing Trigger Rules
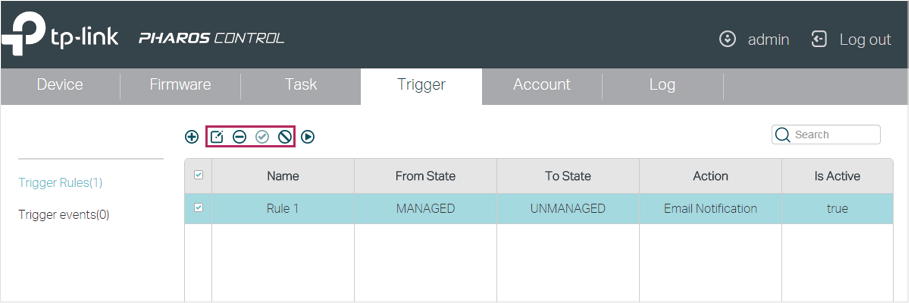
Select one or more trigger rules and do the corresponding operations for this rule.
|
|
Click this button to edit the rule. |
|
|
Click this button to delete the rule. |
|
|
Click this button to activate the rule, and the status of this rule will change from Inactive to Active. |
|
|
Click this button to deactivate the rule, and the status of this rule will change from Active to Inactive. |
|
|
Click this button to make Pharos Control send a test email to the recipient’s mailbox. |
View Trigger Events
Once an event matching any of the rules occurs, an email will be sent and a corresponding trigger event will be recorded in the event list. Click Trigger Events in the left column to view the trigger events.
Figure 4-7 Viewing Trigger Events

|
Name |
Displays the name of the trigger rule. |
|
Device Name |
Displays the name of the device. |
|
Time |
Displays the time when the event happened. |
|
Type |
Displays the type of event. |
|
Action |
Displays the trigger rule type: Manage Device or Email Notification. |
|
Checked or Not |
Displays whether the event has been checked or not. |


