


Introduction to Statistics Page and Export Data Feature on Omada Controller
Contents
Objective
This article introduces the Statistics page and the Export Data feature on the Omada Controller.
Requirements
- Omada Controller (Software Controller / Hardware Controller / Cloud-Based Controller, v5.9 and above)
- Omada device
Introduction
On the Omada Controller's Statistics page, you can view statistics related to the adopted Omada gateways, switches, and APs. You can select the statistical time range and granularities (5 minutes, hourly, daily), making it easier for you to analyze the usage of different devices over various time periods. Additionally, the Export Data feature allows you to export relevant data such as devices, clients, logs, and voucher codes from the Omada Controller, facilitating network operation and management.
Statistics Page
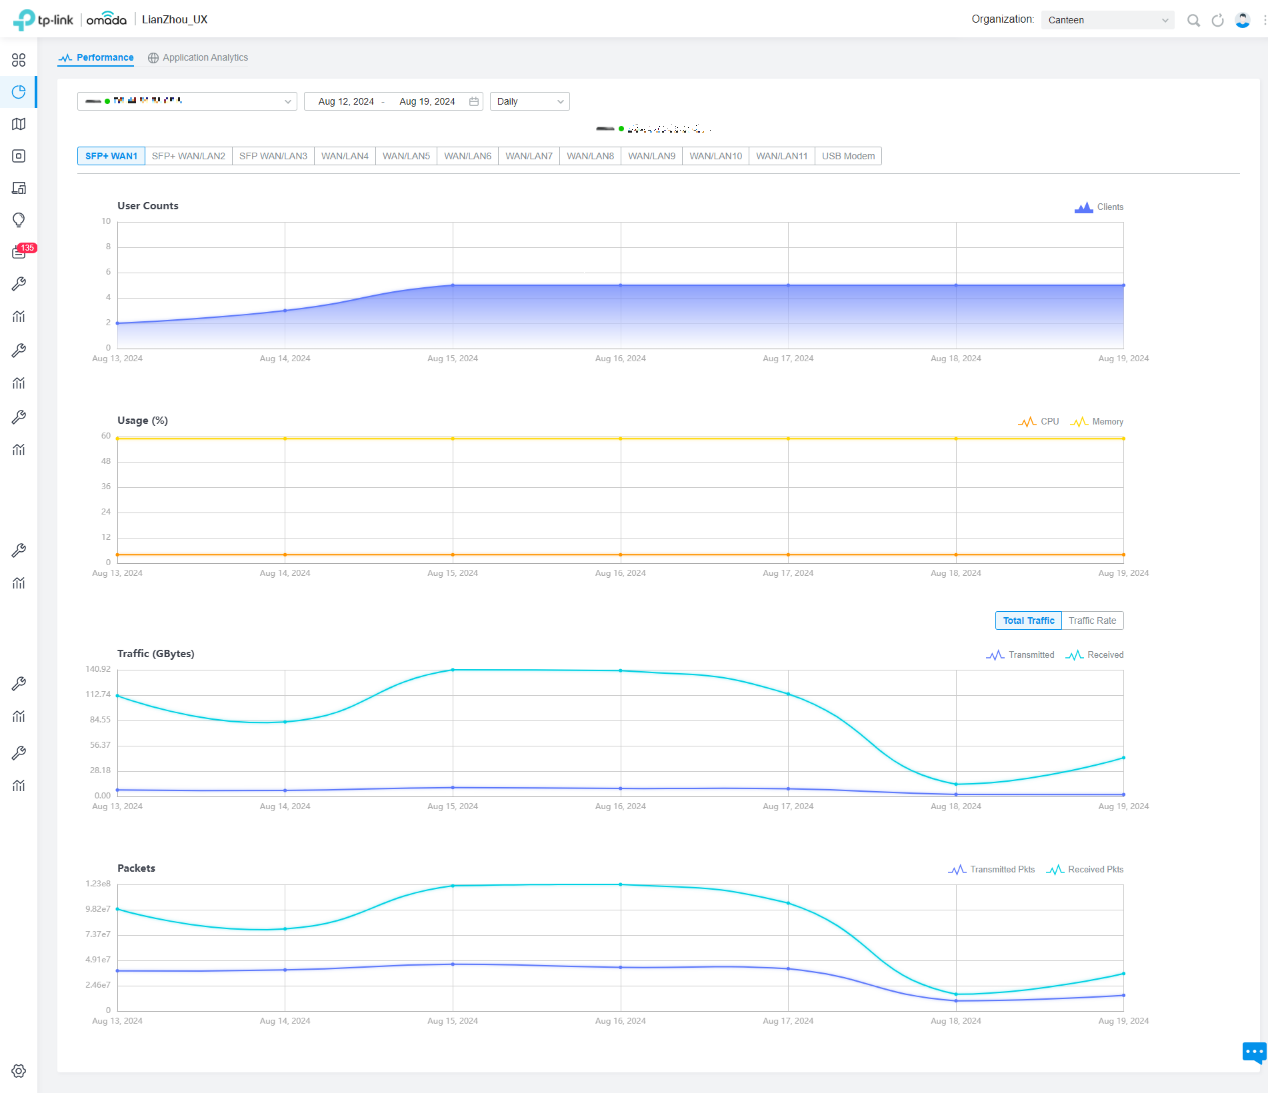
Step 1. Log in to the Controller, go to Statistics > Performance, and select the device you want to view. You can choose the desired time range and time granularity, and the Controller will display various statistical information for the corresponding time period based on the selected granularity.

For different device types, the displayed data and charts will vary:
- Gateway: You can view data of different WAN ports, such as the number of associated clients, CPU & memory usage, transmission traffic, packet statistics, and rates.
- Switch: You can view data of different ports, such as the number of clients, CPU & memory usage, transmission traffic, and port status.

- AP: You can view data of the AP, such as the user count, CPU & memory usage, traffic, packets, multicast/broadcast packets, dropped packets, error packets, and retry packets.

Step 2. Go to the Application Analytics page. Here you can view detailed traffic information if you have adopted a gateway that supports DPI and enabled DPI in Site Settings > Network Security > Application Control.

Export Data
Step 1. Log in to the Controller, and go to Site Settings > Services > Export Data. Here you can export data related to devices, clients, and logs.
Step 2. In the Export List, select the data you want to export:
- Device List: Exports information about the devices adopted at the current site. When exporting the device list, you can configure an email to send the information to a specified email address.
- Client List: Exports information about clients currently connected to the site.
- Rogue AP List: Exports information about rogue APs at the current site.
- Log List: Exports all log information from the current site.
- Authorized Client List: Exports information about authenticated clients at the current site.
- Voucher Code: Exports voucher code information from the current site.

Step 3. Choose the export format, either XLSX or CSV.
Step 4. Click Export.
Additionally, the global view also has the Export Data feature, which functions the same as the feature in the site view, except that you need to choose a specific site to export data.

Conclusion
Now you can use the Statistics page and the Export Data feature on the Omada Controller.
Get to know more details of each function and configuration please go to Download Center to download the manual of your product.
Is this faq useful?
Your feedback helps improve this site.

TP-Link Community
Still need help? Search for answers, ask questions, and get help from TP-Link experts and other users around the world.