

tpNMS
TP-Link ネットワーク管理システム
-
Compatible with any managed Switch that uses industry-standard SNMP
-
Easy-to-use, no special training needed
-
Make network administration more effective and efficient with batch firmware updates
-
Intuitive real-time monitoring
The TP-LINK Management System tpNMS is a comprehensive standards-based management tool designed to centrally manage network switches. It can manage all of the TP-LINK Smart, L2, L2+ and L3 managed switches, and discover third-party network devices that support the SNMP protocol. Flexible and versatile, tpNMS uses cutting-edge web technology to make it more convenient to monitor and administer your network switches.
Simplify Network Management
tpNMS supports various predefined configuration templates which help users easily manage multiple devices. It works with any managed switch that uses industry-standard Simple Network Management Protocol (SNMP). It automatically discovers and maps up to 200 devices on your network without any additional cost: tpNMS is free of charge up to 200 devices.
Network statistics can be graphed in real time, or stored as historical data for trend analysis. Proactive thresholds and alerts (including e-mail notification) detect bottlenecks and other network problems and alert you before users start to call. The user-friendly online graphic interface enables you to monitor everything from network elements to users and groups of devices – from anywhere in the network.
Centralized firmware upgrades
Users can implement batch firmware upgrade through tpNMS, the method is adding the switches with the same software version to the same device group. This feature can greatly reduce the workload of network managers, especially in a large network.
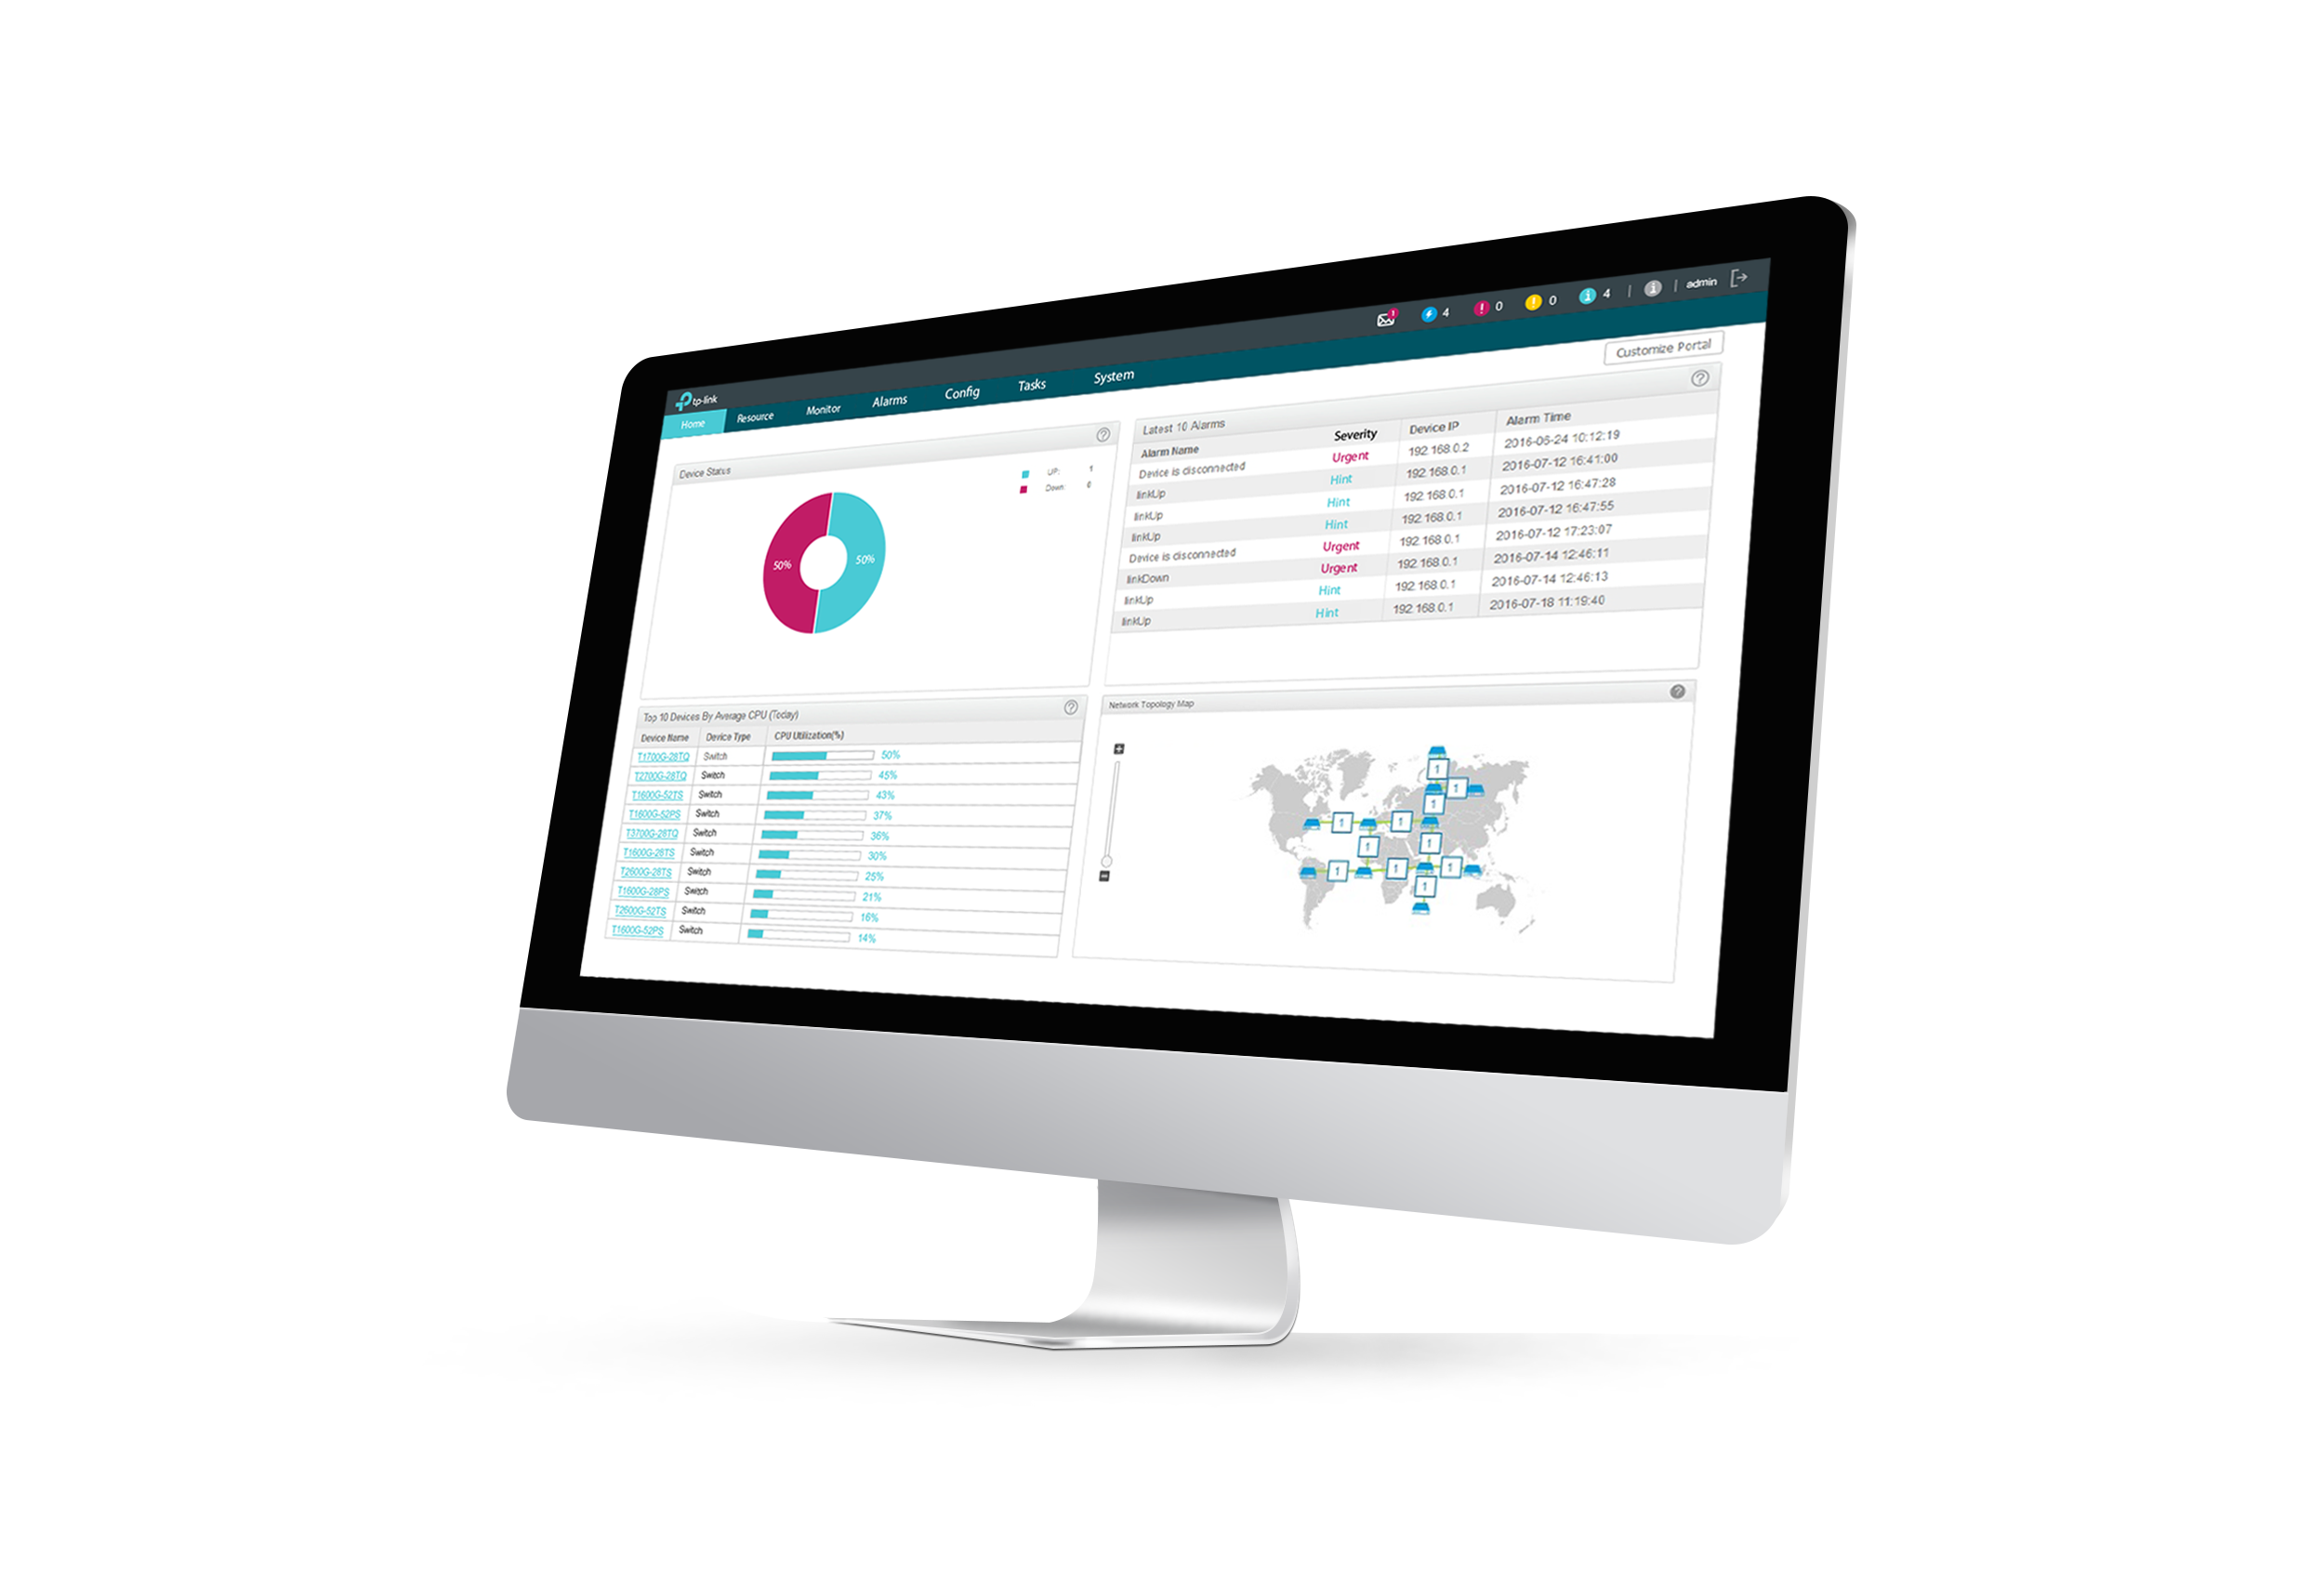
Graphical monitoring
Rich graphic monitoring charts including Device Status, Top 10 Devices, Top 10 Interfaces, Dashboard and Network Topology map make the complex monitoring data more readable so users can easily monitor the entire network through these different graphical charts.
| 一般 | |
|---|---|
| 構成 | Supports standard server client web architecture |
| 標準サーバー要件 | • 2.8 GHz dual-core CPU • 4GB RAM (32-bit OS) or 8GB RAM (64-bit OS) • 20GB HD (free space) • Static IP |
| 言語サポート | English |
| 管理インターフェース対応 | • SNMP (v1, v2c, v3) • TFTP • Telnet/HTTP/HTTPS • Web GUI |
| 検出 | |
|---|---|
| デバイス検出 | • Supports SNMP v1, v2c, v3 scan • Supports single IPv4 address discovery • Supports IPv4 address range scan |
| リンク検出 | Ethernet link discovery with LLDP protocol |
| 自動検出 | Supports scheduled and periodic auto discovery |
| デバイスの同期 | System resynchronization with device table |
| モニタリング | |
|---|---|
| トポロジーマッピング | • Supports adding the customized map manually • Supports devices status display • Supports refreshing the topology map automatically |
| ダッシュボード | • Supports 10 devices or 10 interfaces per dashboard • Supports customized dashboard |
| Top 10 | Supports Top 10 devices and interfaces |
| アラーム | |
|---|---|
| Traps | Supports exporting to local as pdf or excel |
| アラーム構成 | Supports defining the severity level of alarms |
| リモート通知 | Supports for alerts via email with SMTP configuration |
| 構成 | |
|---|---|
| 構成ファイルのバックアップと復元 | • Device config file backup and restoration for applicable devices • 1:1 and 1:Many based on static or dynamic device groups • Immediately or scheduled |
| デバイスのファームウェアアップデート | • 1:1 and 1:Many based on static or dynamic device groups • Immediately or scheduled |